pycharm实现pca代码
时间: 2024-05-04 18:13:36 浏览: 20
PyCharm是一款常用的Python集成开发环境(IDE),它提供了丰富的功能和工具来帮助开发者编写、调试和运行Python代码。PCA(Principal Component Analysis)是一种常用的降维算法,用于将高维数据转换为低维表示。下面是使用PyCharm实现PCA算法的代码示例:
```python
import numpy as np
from sklearn.decomposition import PCA
# 创建一个示例数据集
X = np.array([[1, 2, 3], [4, 5, 6], [7, 8, 9]])
# 创建PCA对象并指定降维后的维度
pca = PCA(n_components=2)
# 对数据进行降维处理
X_pca = pca.fit_transform(X)
# 打印降维后的结果
print(X_pca)
```
在PyCharm中,你可以按照以下步骤来实现PCA代码:
1. 打开PyCharm并创建一个新的Python项目。
2. 在项目中创建一个新的Python文件,例如"pca_example.py"。
3. 将上述代码复制到"pca_example.py"文件中。
4. 运行代码,你将看到降维后的结果输出在控制台上。
相关问题
pycharm实现pca
PyCharm是一款常用的Python集成开发环境(IDE),它提供了丰富的功能和工具来帮助开发者进行Python编程。PCA(Principal Component Analysis,主成分分析)是一种常用的降维算法,用于将高维数据转换为低维数据。
要在PyCharm中实现PCA,可以按照以下步骤进行操作:
1. 安装NumPy和scikit-learn库,这两个库提供了PCA算法的实现。
2. 导入所需库:在Python代码中,使用import语句导入NumPy和scikit-learn库。
3. 加载数据:使用NumPy或其他方法加载需要进行PCA的数据集。
4. 数据预处理:如果需要,对数据进行预处理,例如标准化或归一化。
5. 创建PCA模型:使用scikit-learn库中的PCA类创建PCA模型对象,并设置所需的参数,例如降维后的维度。
6. 拟合数据:使用PCA模型对象对数据进行拟合,即执行PCA算法。
7. 获取降维结果:通过访问PCA模型对象的属性,可以获取降维后的数据。
8. 可视化结果(可选):使用Matplotlib等库对降维后的数据进行可视化展示。
利用pycharm的opencv实现PCA图像融合算法完整代码
以下是利用PyCharm和OpenCV实现PCA图像融合算法的完整代码:
```python
import cv2
import numpy as np
# 读取原始图像
img1 = cv2.imread('image1.jpg')
img2 = cv2.imread('image2.jpg')
# 调整图像大小
img1 = cv2.resize(img1, (256, 256), interpolation=cv2.INTER_CUBIC)
img2 = cv2.resize(img2, (256, 256), interpolation=cv2.INTER_CUBIC)
# 将图像转换为灰度图像
gray1 = cv2.cvtColor(img1, cv2.COLOR_BGR2GRAY)
gray2 = cv2.cvtColor(img2, cv2.COLOR_BGR2GRAY)
# 将灰度图像转换为浮点数类型
gray1 = np.float32(gray1)
gray2 = np.float32(gray2)
# 计算图像的均值和方差
mean1, std1 = cv2.meanStdDev(gray1)
mean2, std2 = cv2.meanStdDev(gray2)
# 将图像减去均值
gray1 -= mean1
gray2 -= mean2
# 计算协方差矩阵
cov1 = np.matmul(gray1.T, gray1)
cov2 = np.matmul(gray2.T, gray2)
# 计算特征值和特征向量
eigenvalues1, eigenvectors1 = np.linalg.eig(cov1)
eigenvalues2, eigenvectors2 = np.linalg.eig(cov2)
# 将特征向量按照特征值从大到小排序
idx1 = np.argsort(-eigenvalues1)
idx2 = np.argsort(-eigenvalues2)
eigenvectors1 = eigenvectors1[:, idx1]
eigenvectors2 = eigenvectors2[:, idx2]
# 选择前 K 个特征向量
K = 100
eigenvectors1 = eigenvectors1[:, :K]
eigenvectors2 = eigenvectors2[:, :K]
# 计算投影矩阵
projection1 = np.matmul(gray1, eigenvectors1)
projection2 = np.matmul(gray2, eigenvectors2)
# 计算重建图像
reconstructed1 = mean1 + np.matmul(projection1, eigenvectors1.T)
reconstructed2 = mean2 + np.matmul(projection2, eigenvectors2.T)
# 将重建图像转换为整型
reconstructed1 = np.uint8(np.clip(reconstructed1, 0, 255))
reconstructed2 = np.uint8(np.clip(reconstructed2, 0, 255))
# 将重建图像融合
alpha = 0.5
blended = cv2.addWeighted(reconstructed1, alpha, reconstructed2, 1-alpha, 0)
# 显示结果
cv2.imshow('Blended Image', blended)
cv2.waitKey(0)
cv2.destroyAllWindows()
```
请注意,此代码需要将图像文件命名为“image1.jpg”和“image2.jpg”并将其放置在与代码文件相同的目录中。您还需要安装OpenCV库才能运行此代码。
相关推荐
最新推荐
Python_从合成数据代码和模型中学习.zip
Python_从合成数据代码和模型中学习
基于Javascript的enroll微信小程序报名设计源码
本项目是基于Javascript的enroll微信小程序报名设计源码,包含35个文件,其中包括8个JSON文件、7个JavaScript文件、6个WXSS文件、5个WXML文件、3个JPG图片文件、3个PNG图片文件、1个Gitignore文件、1个Markdown文件和1个ICO文件。这个项目是一个微信小程序报名设计,旨在通过Javascript和微信小程序技术栈实现,为用户提供便捷的报名服务。
ALINX黑金AX7020 PYNQ3.0.1镜像
编译好的黑金AX7020 PYNQ3.0.1镜像,功能已验证。
芯片ZYNQ7020,具体型号xc7z070clg400-2
受网盘单文件大小限制,使用分卷压缩的方式上传
注意!请自行下载所有的分卷后再解压
lol r3nzskin
lol skin
move it to lol gamed dir
Python处理Excel数据原表保存.rar
Python处理Excel数据原表保存Python处理Excel数据原表保存
zigbee-cluster-library-specification
最新的zigbee-cluster-library-specification说明文档。
管理建模和仿真的文件
管理Boualem Benatallah引用此版本:布阿利姆·贝纳塔拉。管理建模和仿真。约瑟夫-傅立叶大学-格勒诺布尔第一大学,1996年。法语。NNT:电话:00345357HAL ID:电话:00345357https://theses.hal.science/tel-003453572008年12月9日提交HAL是一个多学科的开放存取档案馆,用于存放和传播科学研究论文,无论它们是否被公开。论文可以来自法国或国外的教学和研究机构,也可以来自公共或私人研究中心。L’archive ouverte pluridisciplinaire
MySQL数据库性能提升秘籍:揭秘性能下降幕后真凶及解决策略
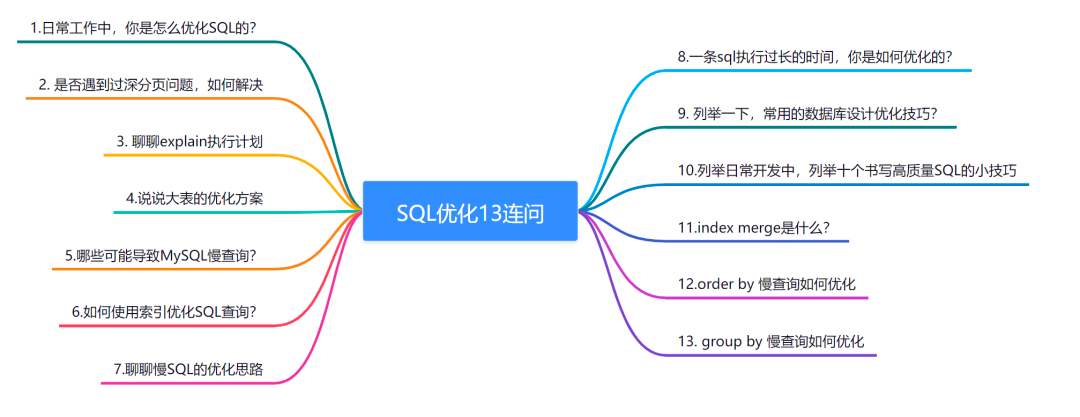
# 1. MySQL数据库性能优化概述**
MySQL数据库性能优化是一项至关重要的任务,可以显著提高应用程序的响应时间和整体用户体验。优化涉及识别和解决影响数据库性能的因素,包括硬件资源瓶颈、软件配置不当和数据库设计缺陷。通过采取适当的优化策略,可以显著提升数据库性能,满足业务需求并提高用户满意度。
# 2. MySQL数据库性能下降的幕后真凶
### 2.1 硬件资源瓶颈
#### 2.1.1 CPU利用率过高
**症状:
如何在unity创建按钮
在 Unity 中创建按钮的步骤如下:
1. 在 Unity 中创建一个 UI Canvas,选择 GameObject -> UI -> Canvas。
2. 在 Canvas 中创建一个按钮,选择 GameObject -> UI -> Button。
3. 在场景视图中调整按钮的位置和大小。
4. 在 Inspector 中设置按钮的文本、颜色、字体等属性。
5. 添加按钮的响应事件,选择按钮,在 Inspector 的 On Click () 中添加相应的方法。
这样就可以创建一个按钮了,你可以在游戏中使用它来触发相应的操作。
JSBSim Reference Manual
JSBSim参考手册,其中包含JSBSim简介,JSBSim配置文件xml的编写语法,编程手册以及一些应用实例等。其中有部分内容还没有写完,估计有生之年很难看到完整版了,但是内容还是很有参考价值的。