python的.pivot
时间: 2023-11-15 13:57:59 浏览: 73
Python中的.pivot()是一个数据透视表函数,它可以将一个DataFrame的记录数据整合成表格,类似于Excel中的数据透视表功能。它可以按照指定的索引列、列名和值来整合数据。.pivot()函数有多种写法,其中一种是pivot(index=None,columns=None,values=None),另一种是pivot('索引列','列名','值'),但官方文档只给出了第一种写法。如果你想了解更多关于Python Pivot table透视表的使用方法,可以参考引用中的示例代码。
相关问题
pd.pivot_table
pandas 中的 `pivot_table` 函数可以用于创建透视表。它接受以下参数:
- `data`: 用于创建透视表的 DataFrame;
- `values`: 需要聚合的列名;
- `index`: 用于分组的列名;
- `columns`: 用于创建列的列名;
- `aggfunc`: 聚合函数,默认为均值。
例如,假设有一个 DataFrame `df`,其中包含 `name`、`year` 和 `score` 三列数据,我们想要按照年份和姓名创建透视表,并且计算每个组的平均分数,可以使用以下代码:
```python
import pandas as pd
df = pd.DataFrame({
'name': ['Alice', 'Bob', 'Alice', 'Charlie', 'Bob', 'Charlie'],
'year': [2018, 2018, 2019, 2019, 2020, 2020],
'score': [80, 85, 90, 95, 85, 90]
})
table = pd.pivot_table(df, values='score', index='year', columns='name', aggfunc='mean')
print(table)
```
输出结果为:
```
name Alice Bob Charlie
year
2018 80.0 85.0 NaN
2019 90.0 NaN 95.0
2020 NaN 85.0 90.0
```
其中,行表示年份,列表示姓名,单元格中的数值表示对应组的平均分数。由于有些组在原始数据中不存在,因此在透视表中对应的单元格显示为 NaN。
d2.pivot_table
D2是一个数据处理库,它主要用于Pandas DataFrame操作,`pivot_table`函数是其内建的一个非常强大的工具,用于创建数据透视表。数据透视表允许你将数据按照指定的列分组,并计算每个组内的聚合值,比如求和、平均值、计数等。通过这个函数,你可以方便地对数据进行汇总分析,快速生成交叉表格。
使用`pivot_table`的基本语法通常是这样的:
```python
pivot_table = df.pivot_table(values=column_to_aggregate,
index=index_column,
columns=column_to_group_by,
aggfunc=aggregation_function)
```
其中:
- `values`: 需要聚合的数值列。
- `index` 和 `columns`: 分别指定了行索引和列标签,决定了数据如何被分组。
- `aggfunc`: 聚合函数,如`sum`, `mean`, `count`, 等。
举个例子,如果你有一个销售数据集,想按产品类别统计每个月的总销售额,可以这样做:
```python
sales_pivot = sales_df.pivot_table(index='Month', columns='Product Category', values='Sales Amount', aggfunc='sum')
```
阅读全文
相关推荐
大家在看
变频器设计资料中关于驱动电路的设计
关于IGBT驱动电路设计!主要介绍了三菱智能模块的应用.
网络信息系统应急预案-网上银行业务持续性计划与应急预案
包含4份应急预案
网络信息系统应急预案.doc
信息系统应急预案.DOCX
信息系统(系统瘫痪)应急预案.doc
网上银行业务持续性计划与应急预案.doc
毕业设计&课设-MATLAB的光场工具箱.zip
matlab算法,工具源码,适合毕业设计、课程设计作业,所有源码均经过严格测试,可以直接运行,可以放心下载使用。有任何使用问题欢迎随时与博主沟通,第一时间进行解答!
matlab算法,工具源码,适合毕业设计、课程设计作业,所有源码均经过严格测试,可以直接运行,可以放心下载使用。有任何使用问题欢迎随时与博主沟通,第一时间进行解答!
matlab算法,工具源码,适合毕业设计、课程设计作业,所有源码均经过严格测试,可以直接运行,可以放心下载使用。有任何使用问题欢迎随时与博主沟通,第一时间进行解答!
matlab算法,工具源码,适合毕业设计、课程设计作业,所有源码均经过严格测试,可以直接运行,可以放心下载使用。有任何使用问题欢迎随时与博主沟通,第一时间进行解答!
matlab算法,工具源码,适合毕业设计、课程设计作业,所有源码均经过严格测试,可以直接运行,可以放心下载使用。有任何使用问题欢迎随时与博主沟通,第一时间进行解答!
matlab算法,工具源码,适合毕业设计、课程设计作业,所有源码均经过严格测试,可以直接运行,可以放心下载使用。有任何使用问题欢迎随
考研计算机408历年真题及答案pdf汇总来了 计算机考研 计算机408考研 计算机历年真题+解析09-23年
408计算机学科专业基础综合考研历年真题试卷与参考答案
真的很全!2009-2023计算机408历年真题及答案解析汇总(pdf
2009-2023计算机考研408历年真题pdf电子版及解析
2023考研408计算机真题全解
专业408历年算题大全(2009~2023年)
考研计算机408历年真题及答案pdf汇总来了
计算机考研 计算机408考研 计算机历年真题+解析09-23年
408计算机学科专业基础综合考研历年真题试卷与参考答案
真的很全!2009-2023计算机408历年真题及答案解析汇总(pdf
2009-2023计算机考研408历年真题pdf电子版及解析
2023考研408计算机真题全解
专业408历年算题大全(2009~2023年)
考研计算机408历年真题及答案pdf汇总来了
计算机考研 计算机408考研 计算机历年真题+解析09-23年
408计算机学科专业基础综合考研历年真题试卷与参考答案
真的很全!2009-2023计算机408历年真题及答案解析汇总(pdf
2009-2023计算机考研408历年真题pdf电子版及解析
2023考研408计算机真题全解
专业4
关于函数包的基本介绍-program management professional ( pgmp ) handbook 2013
一、关于函数包的基本介绍
名称: gstat
版本: 2.0-3
标题:空间和时空地质统计建模、预测和模拟
开发:
Hadley Wickham, hadley@rstudio.com;
Winston Chang, winston@rstudio.com
Lionel ,Henry,Thomas Lin, Pedersen 等等
功能描述:
变差函数建模;简单、普通和通用的点或块(Co)克里格法;时空克里格法;顺序
高斯或指示器(Co)仿真;变差函数和变差函数图绘制实用函数;支持 SF和 STAR。
基于的 R版本:2.10及以上
需要同时导入的包:
utils, stats, graphics, methods, lattice, sp (>= 0.9-72), zoo,spacetime (>= 1.0-0), FNN
一般与其配合使用的包: fields, maps, mapdata, maptools, rgdal (>= 0.5.2), rgeos,
sf(>= 0.7-2), stars (>= 0.3-0), xts, rast
相关信息的存储地址(URL): https://github.com/r-spatial/gstat/
编码:UTF-8
需要编译:是
作者:Edzer PebesmaAut,cre,Benedikt Graeler[Aut]
打包时间:2019-09-26 13:09:08 UTC;Edzer
二、gstat 包有哪些函数
根据资料考究,一个拓展包中的函数分为公开和不公开的,会在扩展包根目录下
的 NAMESPACE文件中定义是 否 Export,如果一个函数没有 Export,则为不公
开的函数,只能在包内部调用。下面使用 ls()函数查看所 有公开的函数,具体
如下:
####gstat包的学习
library(gstat) #加载函数包
## Registered S3 method overwritten by 'xts':
## method from
最新推荐
Python如何操作office实现自动化及win32com.client的运用
例如,你可以使用 `PivotTables.Add` 来创建新的透视表,或者用 `PivotTable.RefreshTable` 来刷新现有透视表的数据。 **自动化报告生成** 在上述的实例中,`AutomationReport` 类用于自动化报告的生成。类的初始化...
微生物细胞壁中S层蛋白的功能与结构解析及其应用前景
内容概要:本文深入探讨了微生物表面层次(S-layer)蛋白质的结构和功能,尤其关注其在古菌和细菌中的角色。文中详细介绍了S层结构特征,如形成二維晶格的方式以及与其他细胞外膜成分的相互作用机制。对于S层的具体生物学作用——从保护细胞到适应环境变化——都有详尽论述,并且对不同种类微生物S层的特异性进行了分类比较。此外,还提到了当前的研究热点和潜在的应用领域。
适合人群:生物学家、微生物学家及其他生命科学研究人员;对细胞生物学特别是细胞壁研究感兴趣的学生及专业人士。
使用场景及目标:作为参考资料帮助科学家理解S层的物理化学属性,为实验设计提供思路,推动相关领域学术交流与发展;也为寻找新的工业材料和技术提供了理论依据。
阅读建议:鉴于论文的技术性强且内容丰富复杂,在初读时可以先把握各章节的大致意义,后续针对个人感兴趣的专题进一步深入了解。由于涉及到大量的分子生物学知识,请确保读者有良好的背景基础。同时推荐配合最新的科研报道一同学习以获取最新进展。
Python调试器vardbg:动画可视化算法流程
资源摘要信息:"vardbg是一个专为Python设计的简单调试器和事件探查器,它通过生成程序流程的动画可视化效果,增强了算法学习的直观性和互动性。该工具适用于Python 3.6及以上版本,并且由于使用了f-string特性,它要求用户的Python环境必须是3.6或更高。 vardbg是在2019年Google Code-in竞赛期间为CCExtractor项目开发而创建的,它能够跟踪每个变量及其内容的历史记录,并且还能跟踪容器内的元素(如列表、集合和字典等),以便用户能够深入了解程序的状态变化。"
知识点详细说明:
1. Python调试器(Debugger):调试器是开发过程中用于查找和修复代码错误的工具。 vardbg作为一个Python调试器,它为开发者提供了跟踪代码执行、检查变量状态和控制程序流程的能力。通过运行时监控程序,调试器可以发现程序运行时出现的逻辑错误、语法错误和运行时错误等。
2. 事件探查器(Event Profiler):事件探查器是对程序中的特定事件或操作进行记录和分析的工具。 vardbg作为一个事件探查器,可以监控程序中的关键事件,例如变量值的变化和函数调用等,从而帮助开发者理解和优化代码执行路径。
3. 动画可视化效果:vardbg通过生成程序流程的动画可视化图像,使得算法的执行过程变得生动和直观。这对于学习算法的初学者来说尤其有用,因为可视化手段可以提高他们对算法逻辑的理解,并帮助他们更快地掌握复杂的概念。
4. Python版本兼容性:由于vardbg使用了Python的f-string功能,因此它仅兼容Python 3.6及以上版本。f-string是一种格式化字符串的快捷语法,提供了更清晰和简洁的字符串表达方式。开发者在使用vardbg之前,必须确保他们的Python环境满足版本要求。
5. 项目背景和应用:vardbg是在2019年的Google Code-in竞赛中为CCExtractor项目开发的。Google Code-in是一项面向13到17岁的学生开放的竞赛活动,旨在鼓励他们参与开源项目。CCExtractor是一个用于从DVD、Blu-Ray和视频文件中提取字幕信息的软件。vardbg的开发过程中,该项目不仅为学生提供了一个实际开发经验的机会,也展示了学生对开源软件贡献的可能性。
6. 特定功能介绍:
- 跟踪变量历史记录:vardbg能够追踪每个变量在程序执行过程中的历史记录,使得开发者可以查看变量值的任何历史状态,帮助诊断问题所在。
- 容器元素跟踪:vardbg支持跟踪容器类型对象内部元素的变化,包括列表、集合和字典等数据结构。这有助于开发者理解数据结构在算法执行过程中的具体变化情况。
通过上述知识点的详细介绍,可以了解到vardbg作为一个针对Python的调试和探查工具,在提供程序流程动画可视化效果的同时,还通过跟踪变量和容器元素等功能,为Python学习者和开发者提供了强大的支持。它不仅提高了学习算法的效率,也为处理和优化代码提供了强大的辅助功能。
管理建模和仿真的文件
管理Boualem Benatallah引用此版本:布阿利姆·贝纳塔拉。管理建模和仿真。约瑟夫-傅立叶大学-格勒诺布尔第一大学,1996年。法语。NNT:电话:00345357HAL ID:电话:00345357https://theses.hal.science/tel-003453572008年12月9日提交HAL是一个多学科的开放存取档案馆,用于存放和传播科学研究论文,无论它们是否被公开。论文可以来自法国或国外的教学和研究机构,也可以来自公共或私人研究中心。L’archive ouverte pluridisciplinaire
【IT设备维保管理入门指南】:如何制定有效的维护计划,提升设备性能与寿命
# 摘要
本文全面探讨了IT设备维保管理的各个方面,从理论基础到实践案例,再到技术革新和未来展望。首先概述了维保计划的重要性,强调了其在延长设备生命周期和提升性能稳定性方面的作用。接着,文中详细论述了维保计划的制定原则,包括预防性维护、设备分类及成本效益分析等。通过分析不同行业的实践案例,本文揭示了成功维保计划的关键因素,并提出了效果评估与改进的策略。随后,探讨了性能监
python爬取网页链接,url = “https://koubei.16888.com/57233/0-0-0-0”
在Python中,使用如`requests`库来发送HTTP请求并抓取网页链接是比较常见的做法。以下是如何使用`requests`和BeautifulSoup库(用于解析HTML)来爬取给定URL上的信息:
首先,确保已安装`requests`和`beautifulsoup4`库,如果未安装可以使用以下命令安装:
```bash
pip install requests beautifulsoup4
```
然后,你可以编写以下Python脚本来爬取指定URL的内容:
```python
import requests
from bs4 import BeautifulSoup
# 定义要
掌握Web开发:Udacity天气日记项目解析
资源摘要信息: "Udacity-Weather-Journal:Web开发路线的Udacity纳米度-项目2"
知识点:
1. Udacity:Udacity是一个提供在线课程和纳米学位项目的教育平台,涉及IT、数据科学、人工智能、机器学习等众多领域。纳米学位是Udacity提供的一种专业课程认证,通过一系列课程的学习和实践项目,帮助学习者掌握专业技能,并提供就业支持。
2. Web开发路线:Web开发是构建网页和网站的应用程序的过程。学习Web开发通常包括前端开发(涉及HTML、CSS、JavaScript等技术)和后端开发(可能涉及各种服务器端语言和数据库技术)的学习。Web开发路线指的是在学习过程中所遵循的路径和进度安排。
3. 纳米度项目2:在Udacity提供的学习路径中,纳米学位项目通常是实践导向的任务,让学生能够在真实世界的情境中应用所学的知识。这些项目往往需要学生完成一系列具体任务,如开发一个网站、创建一个应用程序等,以此来展示他们所掌握的技能和知识。
4. Udacity-Weather-Journal项目:这个项目听起来是关于创建一个天气日记的Web应用程序。在完成这个项目时,学习者可能需要运用他们关于Web开发的知识,包括前端设计(使用HTML、CSS、Bootstrap等框架设计用户界面),使用JavaScript进行用户交互处理,以及可能的后端开发(如果需要保存用户数据,可能会使用数据库技术如SQLite、MySQL或MongoDB)。
5. 压缩包子文件:这里提到的“压缩包子文件”可能是一个笔误或误解,它可能实际上是指“压缩包文件”(Zip archive)。在文件名称列表中的“Udacity-Weather-journal-master”可能意味着该项目的所有相关文件都被压缩在一个名为“Udacity-Weather-journal-master.zip”的压缩文件中,这通常用于将项目文件归档和传输。
6. 文件名称列表:文件名称列表提供了项目文件的结构概览,它可能包含HTML、CSS、JavaScript文件以及可能的服务器端文件(如Python、Node.js文件等),此外还可能包括项目依赖文件(如package.json、requirements.txt等),以及项目文档和说明。
7. 实际项目开发流程:在开发像Udacity-Weather-Journal这样的项目时,学习者可能需要经历需求分析、设计、编码、测试和部署等阶段。在每个阶段,他们需要应用他们所学的理论知识,并解决在项目开发过程中遇到的实际问题。
8. 技术栈:虽然具体的技术栈未在标题和描述中明确提及,但一个典型的Web开发项目可能涉及的技术包括但不限于HTML5、CSS3、JavaScript(可能使用框架如React.js、Angular.js或Vue.js)、Bootstrap、Node.js、Express.js、数据库技术(如上所述),以及版本控制系统如Git。
9. 学习成果展示:完成这样的项目后,学习者将拥有一个可部署的Web应用程序,以及一个展示他们技术能力的项目案例,这些对于未来的求职和职业发展都是有价值的。
10. 知识点整合:在进行Udacity-Weather-Journal项目时,学习者需要将所学的多个知识点融合在一起,包括前端设计、用户体验、后端逻辑处理、数据存储和检索、以及可能的API调用等。
总结来说,Udacity-Weather-Journal项目是Udacity Web开发纳米学位课程中的一个重要实践环节,它要求学习者运用他们所学到的前端和后端开发技能,完成一个具体的Web应用程序项目。通过完成这样的项目,学习者能够将理论知识转化为实践经验,并为他们未来在IT行业的职业发展打下坚实的基础。
"互动学习:行动中的多样性与论文攻读经历"
多样性她- 事实上SCI NCES你的时间表ECOLEDO C Tora SC和NCESPOUR l’Ingén学习互动,互动学习以行动为中心的强化学习学会互动,互动学习,以行动为中心的强化学习计算机科学博士论文于2021年9月28日在Villeneuve d'Asq公开支持马修·瑟林评审团主席法布里斯·勒菲弗尔阿维尼翁大学教授论文指导奥利维尔·皮耶昆谷歌研究教授:智囊团论文联合主任菲利普·普雷教授,大学。里尔/CRISTAL/因里亚报告员奥利维耶·西格德索邦大学报告员卢多维奇·德诺耶教授,Facebook /索邦大学审查员越南圣迈IMT Atlantic高级讲师邀请弗洛里安·斯特鲁布博士,Deepmind对于那些及时看到自己错误的人...3谢谢你首先,我要感谢我的两位博士生导师Olivier和Philippe。奥利维尔,"站在巨人的肩膀上"这句话对你来说完全有意义了。从科学上讲,你知道在这篇论文的(许多)错误中,你是我可以依
【文献整理高效法】:ENDNOTE软件实用功能及快捷操作揭秘
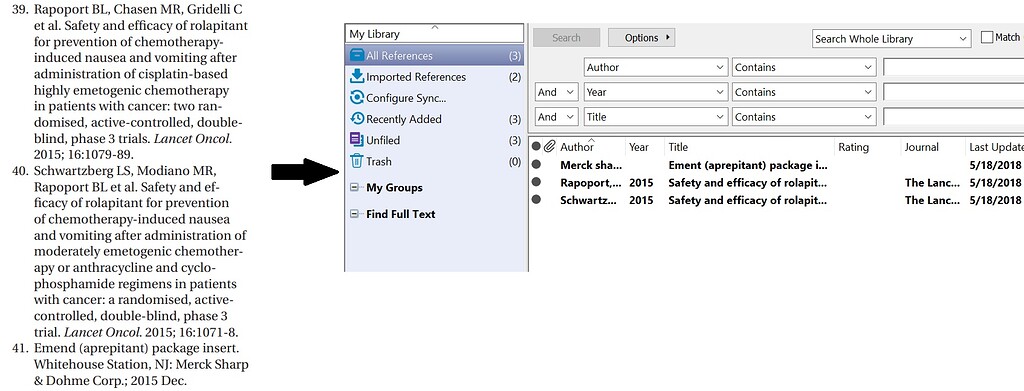
# 摘要
本文综合探讨了ENDNOTE在文献整理和管理中的作用及其高效操作技巧。首先介绍了文献整理的重要性和ENDNOTE软件的简介,随后深入解析了ENDNOTE的基本功能,包括文献信息的导入与管理、引用和参考文献的生成,以及文献搜索与数据库集成。接着,本文详细阐述了ENDNOTE的高效操作技巧,涵
在使用SQL创建存储过程时,是否可以在定义输入参数时直接为其赋予初始值?
在使用SQL创建存储过程时,通常可以在定义输入参数时为其赋予初始值。这种做法可以使参数具有默认值,当调用存储过程时,如果没有提供该参数的值,则会使用默认值。以下是一个示例:
```sql
CREATE PROCEDURE MyProcedure
@Param1 INT = 10,
@Param2 NVARCHAR(50) = 'DefaultValue'
AS
BEGIN
-- 存储过程的主体
SELECT @Param1 AS Param1, @Param2 AS Param2
END
```
在这个示例中,`@Param1`和`@Param2`是输入参数