matplotlib 的legend函数
时间: 2023-11-03 12:59:28 浏览: 112
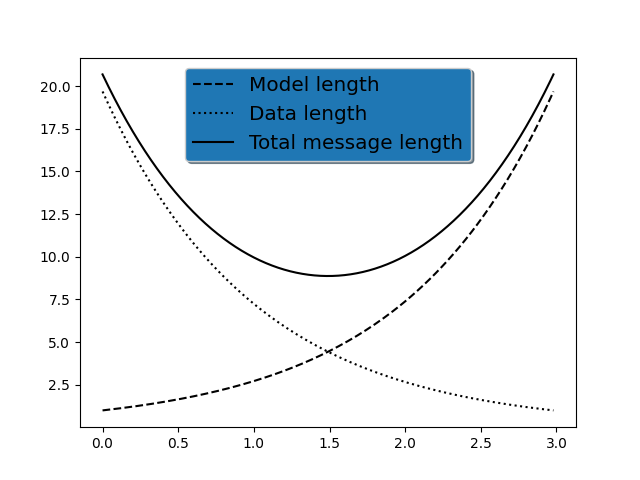
`matplotlib` 的 `legend` 函数用于添加图例。图例是一种标识图表中每个数据系列的方式,通常使用不同的颜色或标记来表示不同的数据系列。下面是一个简单的例子:
```python
import matplotlib.pyplot as plt
import numpy as np
x = np.linspace(0, 10, 100)
y1 = np.sin(x)
y2 = np.cos(x)
plt.plot(x, y1, label='sin(x)')
plt.plot(x, y2, label='cos(x)')
plt.legend()
plt.show()
```
这个例子中,我们使用 `plot` 函数绘制了两条线,并分别给它们指定了标签。`legend` 函数就是用来显示这些标签的。不带参数调用 `legend` 函数会自动将所有标签添加到图例中:

`legend` 函数有很多参数,可以用来控制图例的位置、边框、字体等属性。例如,`loc` 参数可以指定图例的位置,可以是一个字符串,也可以是一个元组。常用的字符串包括:`upper left`、`upper right`、`lower left`、`lower right`、`center left`、`center right`、`lower center`、`upper center` 和 `center`。如果是一个元组,它会指定图例的左下角的位置,例如 `(0.5, 0.5)` 表示图例的左下角位于坐标轴的中心。
下面是一个例子:
```python
import matplotlib.pyplot as plt
import numpy as np
x = np.linspace(0, 10, 100)
y1 = np.sin(x)
y2 = np.cos(x)
plt.plot(x, y1, label='sin(x)')
plt.plot(x, y2, label='cos(x)')
plt.legend(loc='upper right', frameon=False)
plt.show()
```
这个例子中,我们将图例位置设置为右上角,并且去掉了边框:

阅读全文