"HY-2与Jason-2高度计数据对比及Matlab GUI系统开发研究"
版权申诉
107 浏览量
更新于2024-02-20
收藏 3.62MB PDF 举报
The study conducted in the document "HY-2与Jason-2高度计数据对比及基于Matlab GUI的系统开发_毕业论文.pdf" focuses on the comparison of altimeter data from the HY-2 and Jason-2 satellites, as well as the development of a system based on Matlab GUI. The HY-2 satellite, launched in August 2011, is equipped with an altimeter that can monitor sea surface height, sea surface wind speed, and significant wave height globally and continuously. This paper presents a detailed analysis of the main measurement parameters of the HY-2 and Jason-2 satellites, highlighting differences and similarities in their data.
The comparison of altimeter data from HY-2 and Jason-2 satellites is crucial for understanding the accuracy and reliability of sea level measurements. By examining the data from both satellites, researchers can identify any discrepancies and improve the quality of the measurements. The study in the document provides valuable insights into the performance of the altimeters on these satellites and their ability to monitor sea surface conditions effectively.
In addition to the data comparison, the document also discusses the development of a system based on Matlab GUI for analyzing and visualizing the altimeter data. The use of Matlab GUI allows for a user-friendly interface that facilitates data processing and interpretation. By developing a system that streamlines the analysis of altimeter data, researchers can improve efficiency and accuracy in studying sea surface dynamics.
Overall, the document "HY-2与Jason-2高度计数据对比及基于Matlab GUI的系统开发_毕业论文.pdf" offers a comprehensive analysis of altimeter data from the HY-2 and Jason-2 satellites, as well as an innovative approach to system development using Matlab GUI. This study contributes to the advancement of oceanographic research and enhances our understanding of sea surface dynamics.
HY-2 与 Jason-2 高度计数据对比及基于 Matlab GUI 的系统开发
7
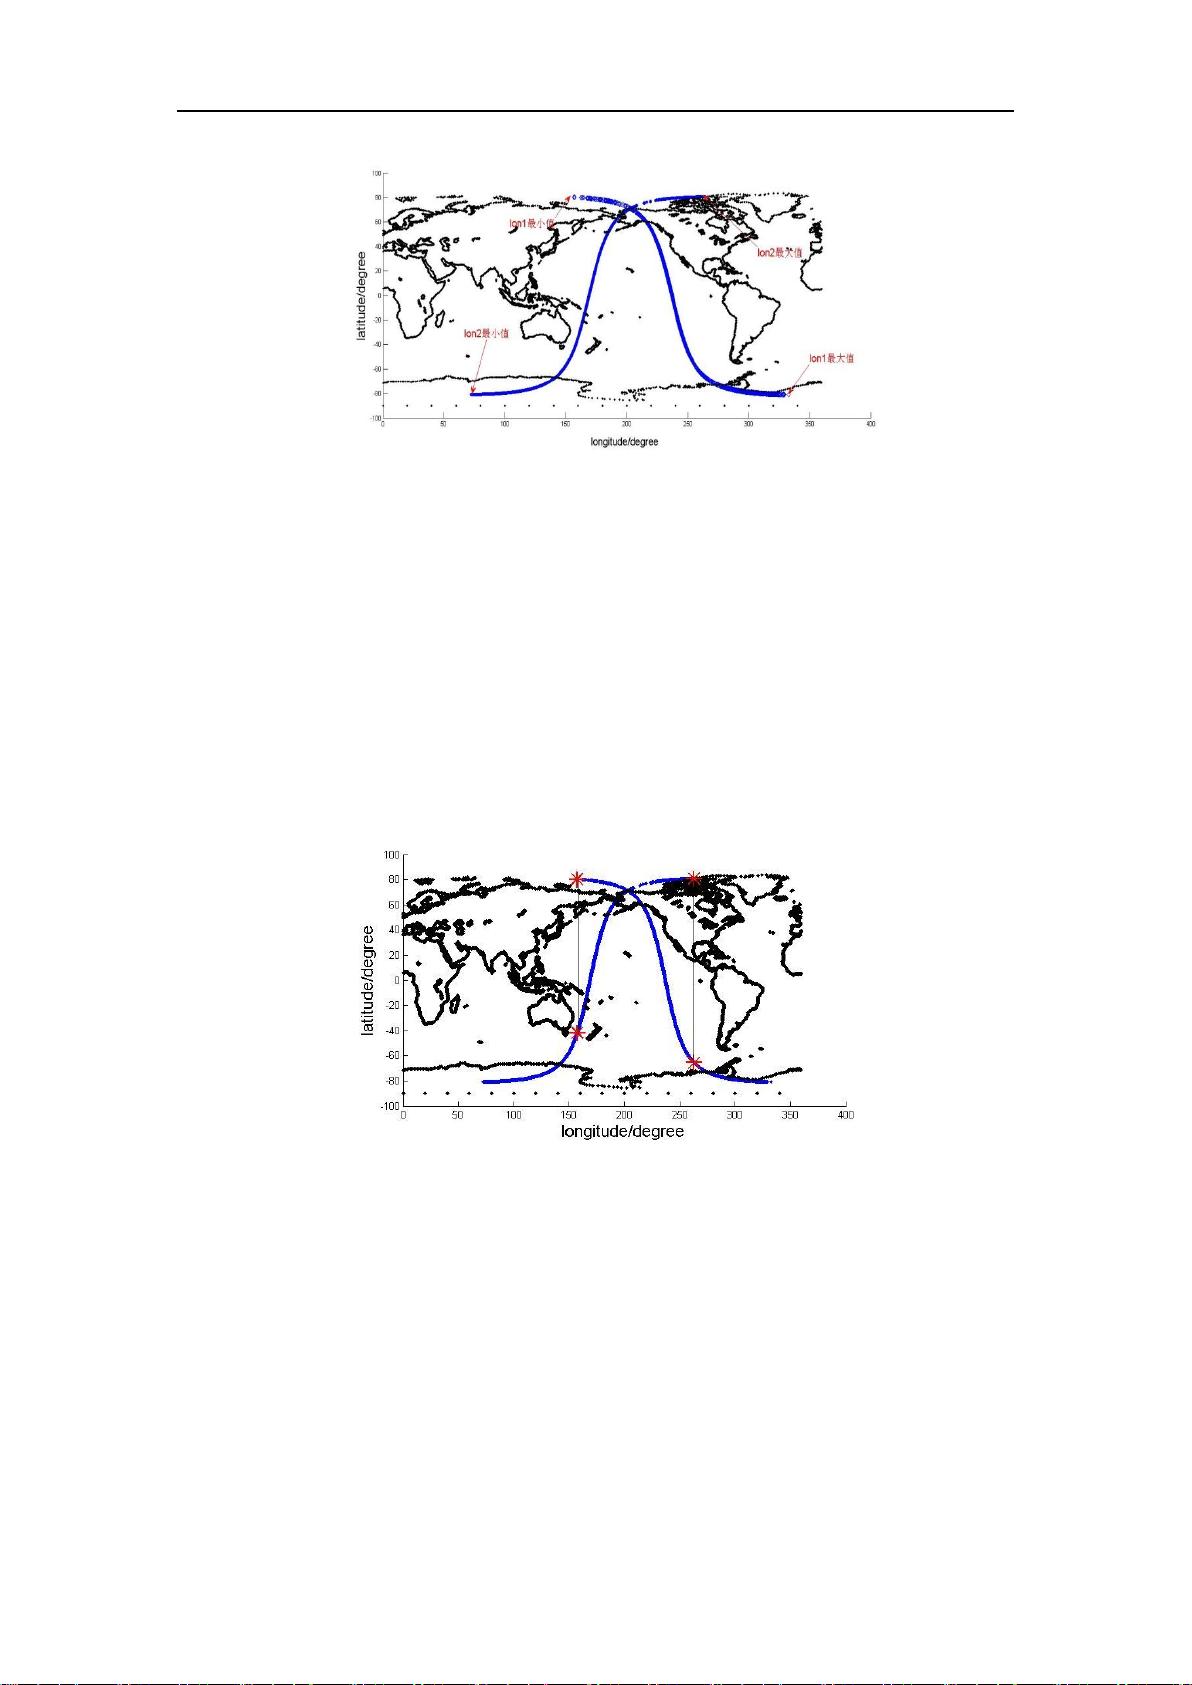
图 2-1 粗略判断有无交叉点
缩小交叉点的区域范围,将 lon1 的最大值、最小值和 lon2 的最大值、最小
值四个数进行排序,根据前一步的交叉点判断方法可以知道中间大小的两个值分
别位于两个矩阵中。两个值在两个矩阵相互映射出四个点,如图 2-2 所示红色*
标记的四个点,交叉点就位于这四个点之间的区域。将 这四个点之间的矩阵截取
出来组成新的矩阵[lon1',lat1'],[lon2',lat2'],对两个矩阵分别进行插值,增加数值密
度能够使得 lat1'和 lat2'的个数相等,并且能一一对应。
图 2-2 存在交叉点的区间范围
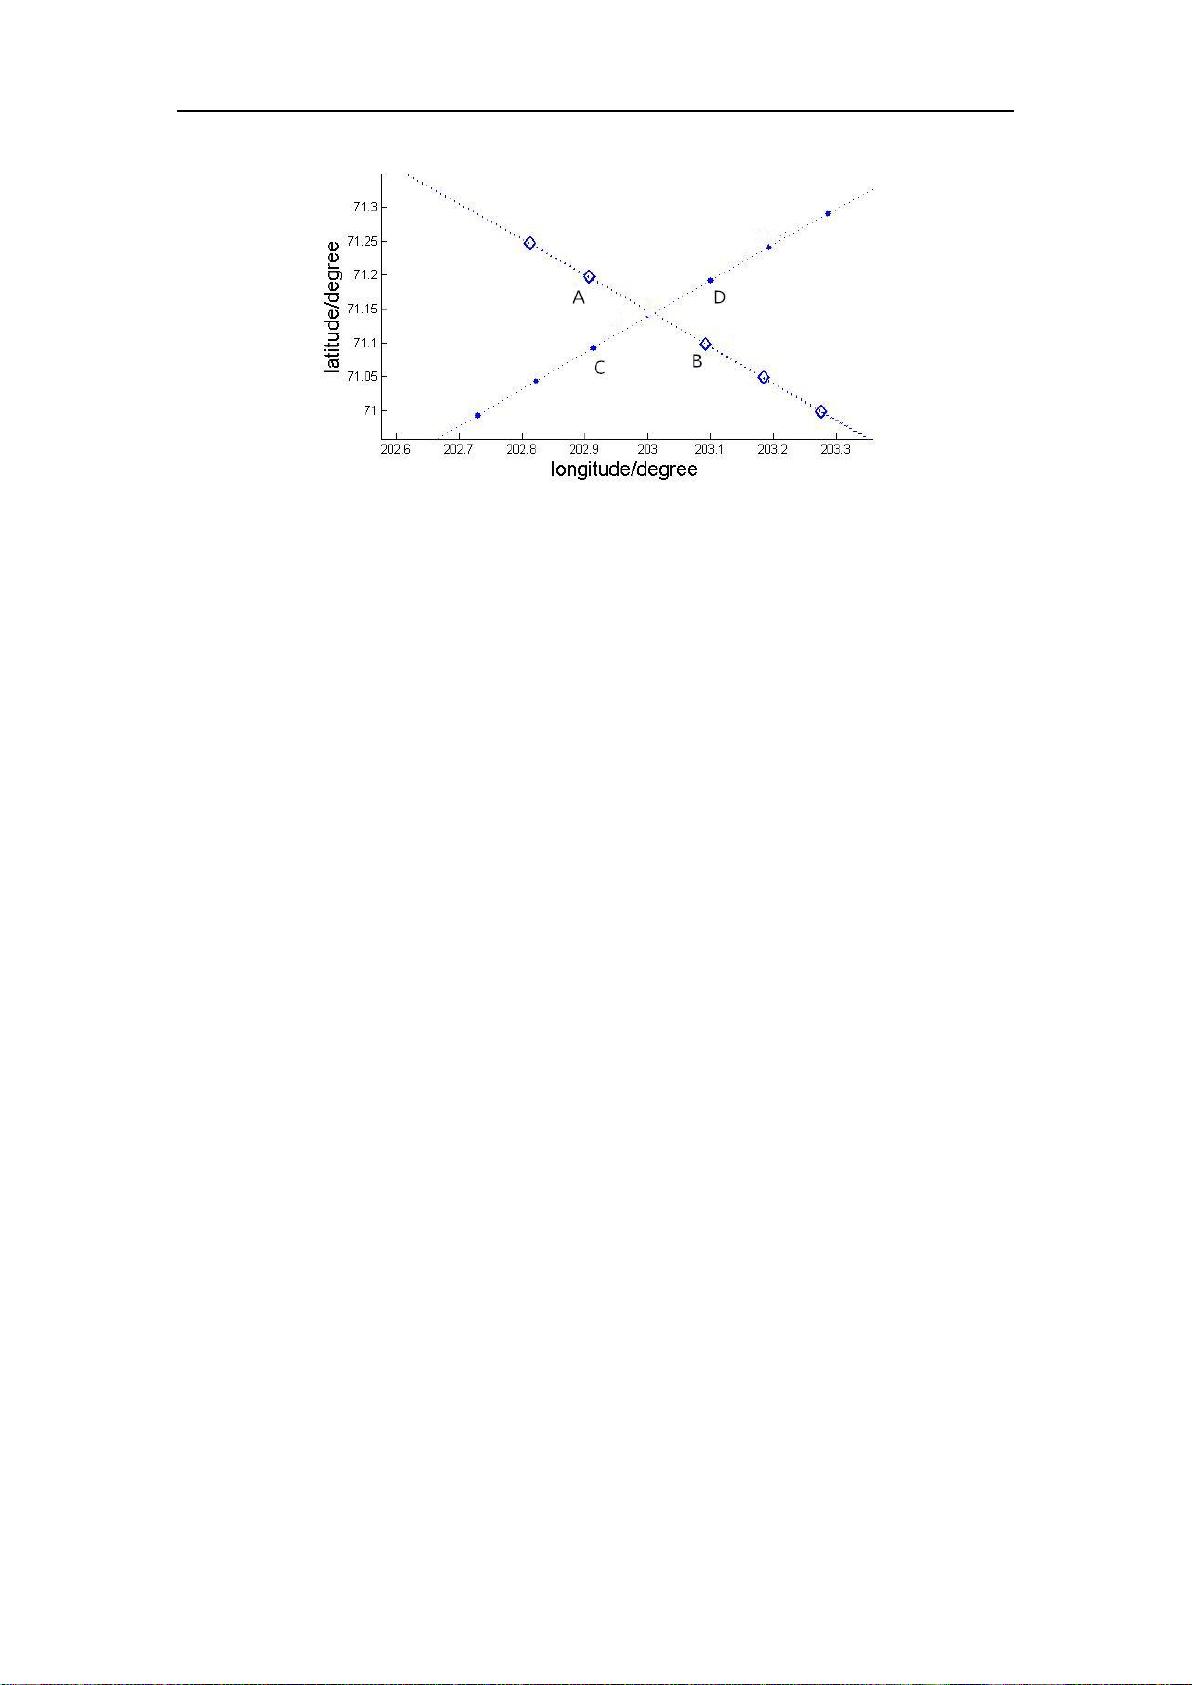
插值完成后,令 dlat=lat1'-lat2',判断 dlat 的符号,找出 dlat 中数值由正值变
为负值或者由负值变为正值的位置,即矩阵索引号 m,这样可以找到在两个矩阵
中交叉点前后的四个点(lon1'(m),lat1'(m))、(lon1'(m+1),lat1'(m+1))、( lon2'(m),
lat2'(m))、(lon2'(m+1),lat2'(m+1)),交叉点就位于这四个点之间。然后根据这四
个插值点在原矩阵中找出四个实测的数据点,分别命名为 A、B、C、D,如图
2-3 所示,精确的交叉点就位于这四个点之间。
剩余61页未读,继续阅读
2021-07-10 上传
2022-07-15 上传
2014-08-04 上传
2023-06-09 上传
2024-09-26 上传
2024-09-26 上传
2023-06-08 上传
2023-06-03 上传
2023-06-13 上传
2023-07-09 上传


xox_761617
- 粉丝: 25
- 资源: 7803
 我的内容管理
展开
我的内容管理
展开


最新资源
- 磁性吸附笔筒设计创新,行业文档精选
- Java Swing实现的俄罗斯方块游戏代码分享
- 骨折生长的二维与三维模型比较分析
- 水彩花卉与羽毛无缝背景矢量素材
- 设计一种高效的袋料分离装置
- 探索4.20图包.zip的奥秘
- RabbitMQ 3.7.x延时消息交换插件安装与操作指南
- 解决NLTK下载停用词失败的问题
- 多系统平台的并行处理技术研究
- Jekyll项目实战:网页设计作业的入门练习
- discord.js v13按钮分页包实现教程与应用
- SpringBoot与Uniapp结合开发短视频APP实战教程
- Tensorflow学习笔记深度解析:人工智能实践指南
- 无服务器部署管理器:防止错误部署AWS帐户
- 医疗图标矢量素材合集:扁平风格16图标(PNG/EPS/PSD)
- 人工智能基础课程汇报PPT模板下载
