Java Performance Optimization
BY PIERRE-HUGUES CHARBONNEAU
» JVM Internals
» Class Loading
» Garbage Collection
» Java Concurrency
» Application Budgeting
» Tools
» And more...
JAVA ENTERPRISE EDITION 7
Java is among the most widely used programming languages in the
software development world today. Java applications are used within many
verticals (banking, telecommunications, healthcare, etc.), and in some
cases each vertical suggests a particular set of design optimizations. Many
performance-related best practices are common to applications of all kinds.
The purpose of this Refcard is to help developers improve application
performance in as many business contexts as possible by focusing on the
JVM internals, performance tuning principles and best practices, and how
to make use of available monitoring and troubleshooting tools.
It is possible to dene “optimal performance” in different ways, but the
basic elements are: the ability of a Java program to perform its computing
tasks within the business response time requirements, and the ability
of an application to fulll its business functions under high volume, in
a timely manner, with high reliability and low latency. Sometimes the
numbers themselves become patternized: for some major websites, a
page response time of 500ms maximum per user function is considered
optimal. This Refcard will include target numbers when appropriate,
but in most cases you will need to decide these on your own, based on
business requirements and existing performance benchmarks.
JVM INTERNALS
FOUNDATIONS
CODE COMPILATION AND JIT
Java byte code interpretation is clearly not as fast as native code executed
directly from the host. In order to improve performance, the HotSpot JVM
looks for the busiest areas of byte code and compiles these into native,
more efcient, machine code (adaptive optimization). Such native code is
then stored in the code cache in non-heap memory.
NOTE: most JVM implementations offer ways to disable the JIT compiler
(Djava.compiler=NONE). You should only consider disabling such crucial
optimization in the event of unexpected JIT problems such as JVM crashes.
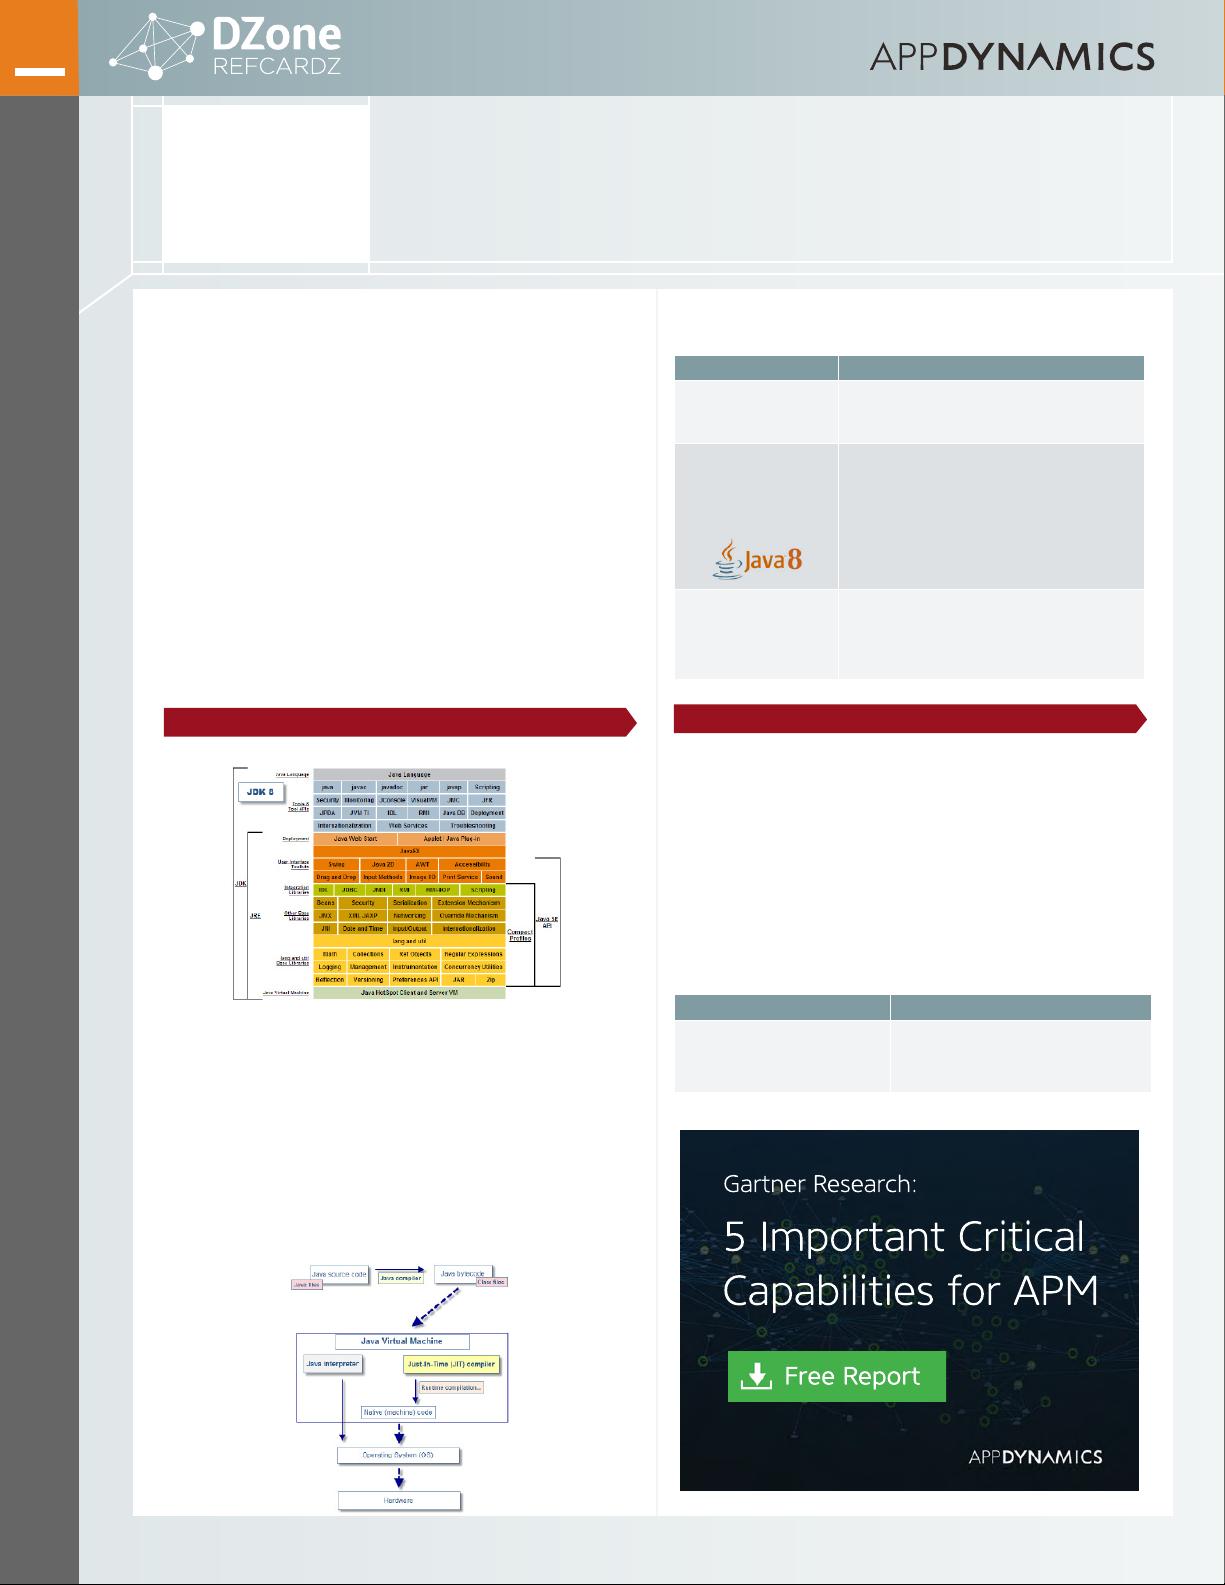
The following diagram illustrates the Java source code, just-in-time
compilation processes and life cycle.
Get More Refcardz! Visit Refcardz.com
BROUGHT TO YOU IN PARTNERSHIP WITH:
200
JAVA PERFORMANCE OPTIMIZATION
MEMORY SPACES
The HotSpot Java Virtual Machine is composed of the following memory spaces.
MEMORY SPACE DESCRIPTION
Java Heap
Primary storage of the Java program class
instances and arrays.
Permanent Generation
(JDK 1.7 and older)
Metaspace
(JDK 1.8 and later)
Primary storage for the Java class metadata.
NOTE: Starting with Java 8, the PermGen space
is replaced by the Metaspace and using native
memory, similar to the IBM J9 JVM.
Native Heap
(C-Heap)
Native memory storage for the Threads, Stack,
code cache including objects such as MMAP les
and third party native libraries.
CLASS LOADING
Another important feature of Java is its ability to load your compiled Java
classes (bytecode) following the start-up of the JVM. Depending on the
size of your application, the class loading process can be intrusive and
signicantly degrade the performance of your application under high load
following a fresh restart. This short-term penalty can also be explained by
the fact that the internal JIT compiler has to start over its optimization work
following a restart.
It is important to note that several improvements were introduced since
JDK 1.7, such as the ability for the default JDK class loader to better load
classes concurrently.
HOT SPOTS
AREA OF CONCERN RECOMMENDATION
Performance degradation following
a JVM restart.
Avoid deploying an excessive amount
of Java classes to a single application
classloader (ex: very large WAR le).
Free Report
]
5 Important Critical
Capabilities for APM
Gartner Research:
CONTENTS
© DZONE, INC.
|
DZONE.COM


