黄河流域典型湿地基于高光谱导数变换的分类研究
下载需积分: 9 | PDF格式 | 1.08MB |
更新于2024-09-09
| 151 浏览量 | 举报
本文主要探讨了黄河流域典型湿地分类的改进方法,特别是在高光谱遥感图像处理领域。研究聚焦于黄河流域河口沿海湿地,利用PROBACHRIS高光谱遥感数据,并特别关注一阶导数变换这一预处理技术。作者通过将一阶导数变换应用到原始图像上,旨在评估这种转换对监督分类算法性能的影响。
文章首先介绍了五种经典的监督分类方法,包括最大似然法、支持向量机(SVM)、决策树、随机森林和神经网络。这些方法在未经导数变换和经过变换后的图像上分别进行应用。研究者通过对两种情况下分类结果的主观解释和定量分析,对比了导数变换前后的分类效果。
实验结果显示,一阶导数变换显著提升了某些监督分类算法在黄河流域沿海湿地分类任务中的表现。这种变换可能有助于增强图像的细节信息,减少纹理和光谱混淆,从而提高分类精度。尤其对于那些依赖于边缘信息和局部特征的分类算法,如边缘检测和局部特征提取,导数变换可以显著增强这些特征的表达。
此外,导数变换可能通过降低数据的维度和噪声影响,改善了分类模型的稳定性和泛化能力。然而,值得注意的是,不同的分类算法对导数变换的反应可能有所不同,这取决于它们对数据特征的依赖程度和适应性。
总结来说,黄河流域典型湿地的高光谱遥感图像通过一阶导数变换后,能够优化监督分类过程,提高湿地类型识别的准确性。这对于湿地生态监测、资源管理以及环境变化研究具有重要的实际意义。未来的研究可以进一步探索不同类型的导数变换以及其在其他复杂地理区域的应用潜力。
changes little, the de-noising effect is good, and the original radiance data image was converted to reflectance data image.
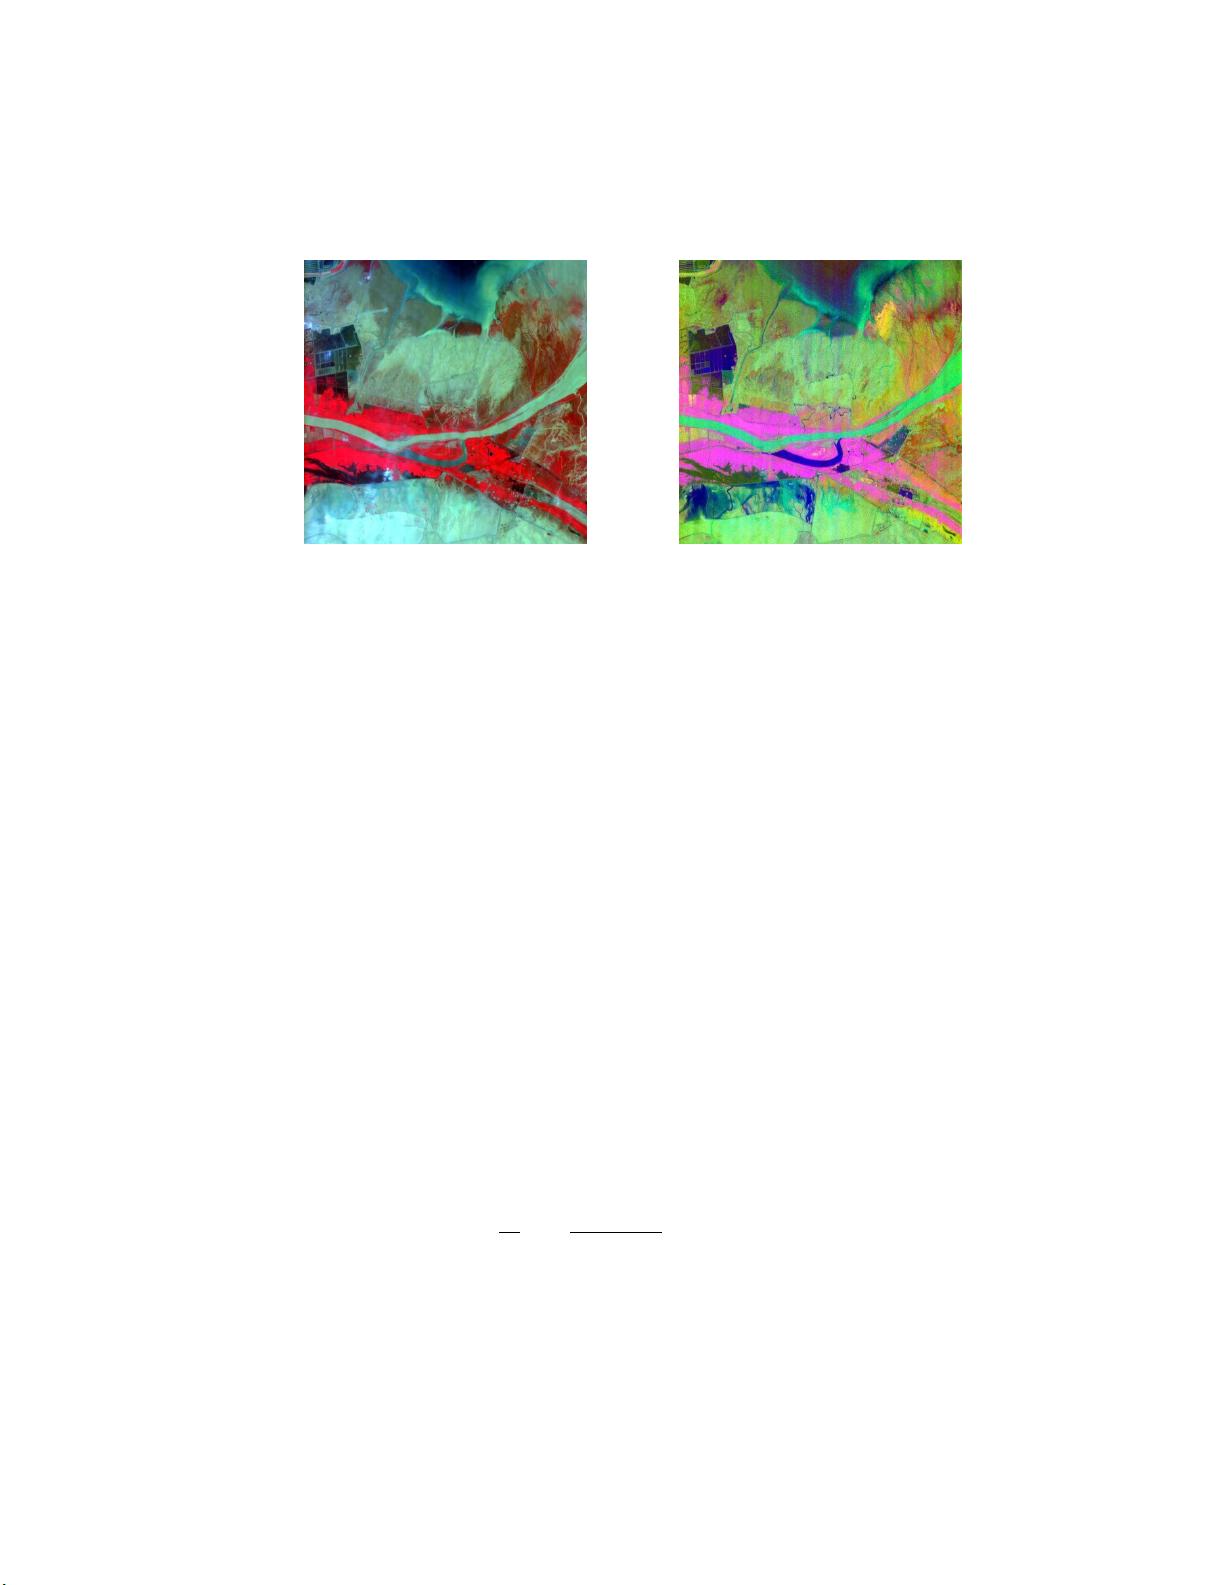
The whole scene preprocessed image was used as the experimental data (hereinafter referred to as the BD image), as
shown in Figure 1 (a).
(a)BD Image (b)AD Image
Figure1. Experimental Image(R:786.1nm,G:593.2nm,B:511.5nm, false color composite)
2.2 Field work
The image coverage area is located at the junction of the old and new river channel in the Yellow River Estuary. The
object types in this area are rich, natural wetland including reed, seepweed, tamarisk and tidal flat, artificial wetland
including aquaculture water, reservoir and pond. In order to evaluate the experimental classification accuracy accurately,
the author's research group carried out the field reconnaissance in September 2012, stroked 48km, using the method of
typical sample area and route records to collect hyperspectral data of object types, more than 100 groups of hyperspectral
data and 230 photos were acquired. Using the interactive interpretation guided by the field work data, the interpreting
images of the CHRIS image covering area were generated (Figure 4), in which red for reed wetland, yellow for bare
beach, blue for clear water (seawater and pond), green for turbid water (the Yellow River), cyan for seepweed, purple for
tamarisk.
2.3 Derivative transformation
Derivative transform is a nonlinear mathematical transformation method. It can effectively highlight the slope
characteristics of the spectral curves, allowing researchers get easier to compare the spectral characteristics of the object
spectral curve. In the mages after derivative transformation, the characteristic information of spectrum is highlighted, and
is beneficial to the land cover identification and classification. In this study, the first-order derivative algorism is
estimated by Eq. (1)
|
=
[5]
(1)
Where
λ
i
and
λ
j
is the center wavelength of image bands, s(
λ
)is the true signal spectrum of the band
λ
, ∆λ is the
separation between adjacent bands,
∆λ=
λ
i
-
λ
j
, and
λ
i
>
λ
j
.
The experimental image data was transformed using the first-order derivative transformation formula of Eq. (1), the
transformed image (hereinafter referred to as the AD image) as shown in Figure 1 (B). After derivative transform, the
Proc. of SPIE Vol. 9142 91421O-3
Downloaded From: http://proceedings.spiedigitallibrary.org/ on 11/27/2015 Terms of Use: http://spiedigitallibrary.org/ss/TermsOfUse.aspx
剩余11页未读,继续阅读
相关推荐


chenqing12321
- 粉丝: 0
 我的内容管理
展开
我的内容管理
展开


最新资源
- 网狐工具:核心DLL和程序文件解析
- PortfolioCVphp - 展示JavaScript技能的个人作品集
- 手机归属地查询网站完整项目:HTML+PHP源码及数据集
- 昆仑通态MCGS通用版S7400父设备驱动包下载
- 手机QQ登录工具的压缩包内容解析
- Git基础学习仓库:掌握版本控制要点
- 3322动态域名更新器使用教程与下载
- iOS源码开发:温度转换应用简易教程
- 定制化用户登录页面模板设计指南
- SMAC电机在包装生产线应用的技术案例分析
- Silverlight 5实现COM组件调用无需OOB技术
- C#实现多功能画图板:画直线、矩形、圆等
- 深入探讨C#语言在WPF项目开发中的应用
- 新版2012109通用权限系统源码发布:多角色用户支持
- 计算机科学与工程系网站开发技术源码合集
- Java实现简易导出Excel工具的开发教程
