Core-Specific Tools
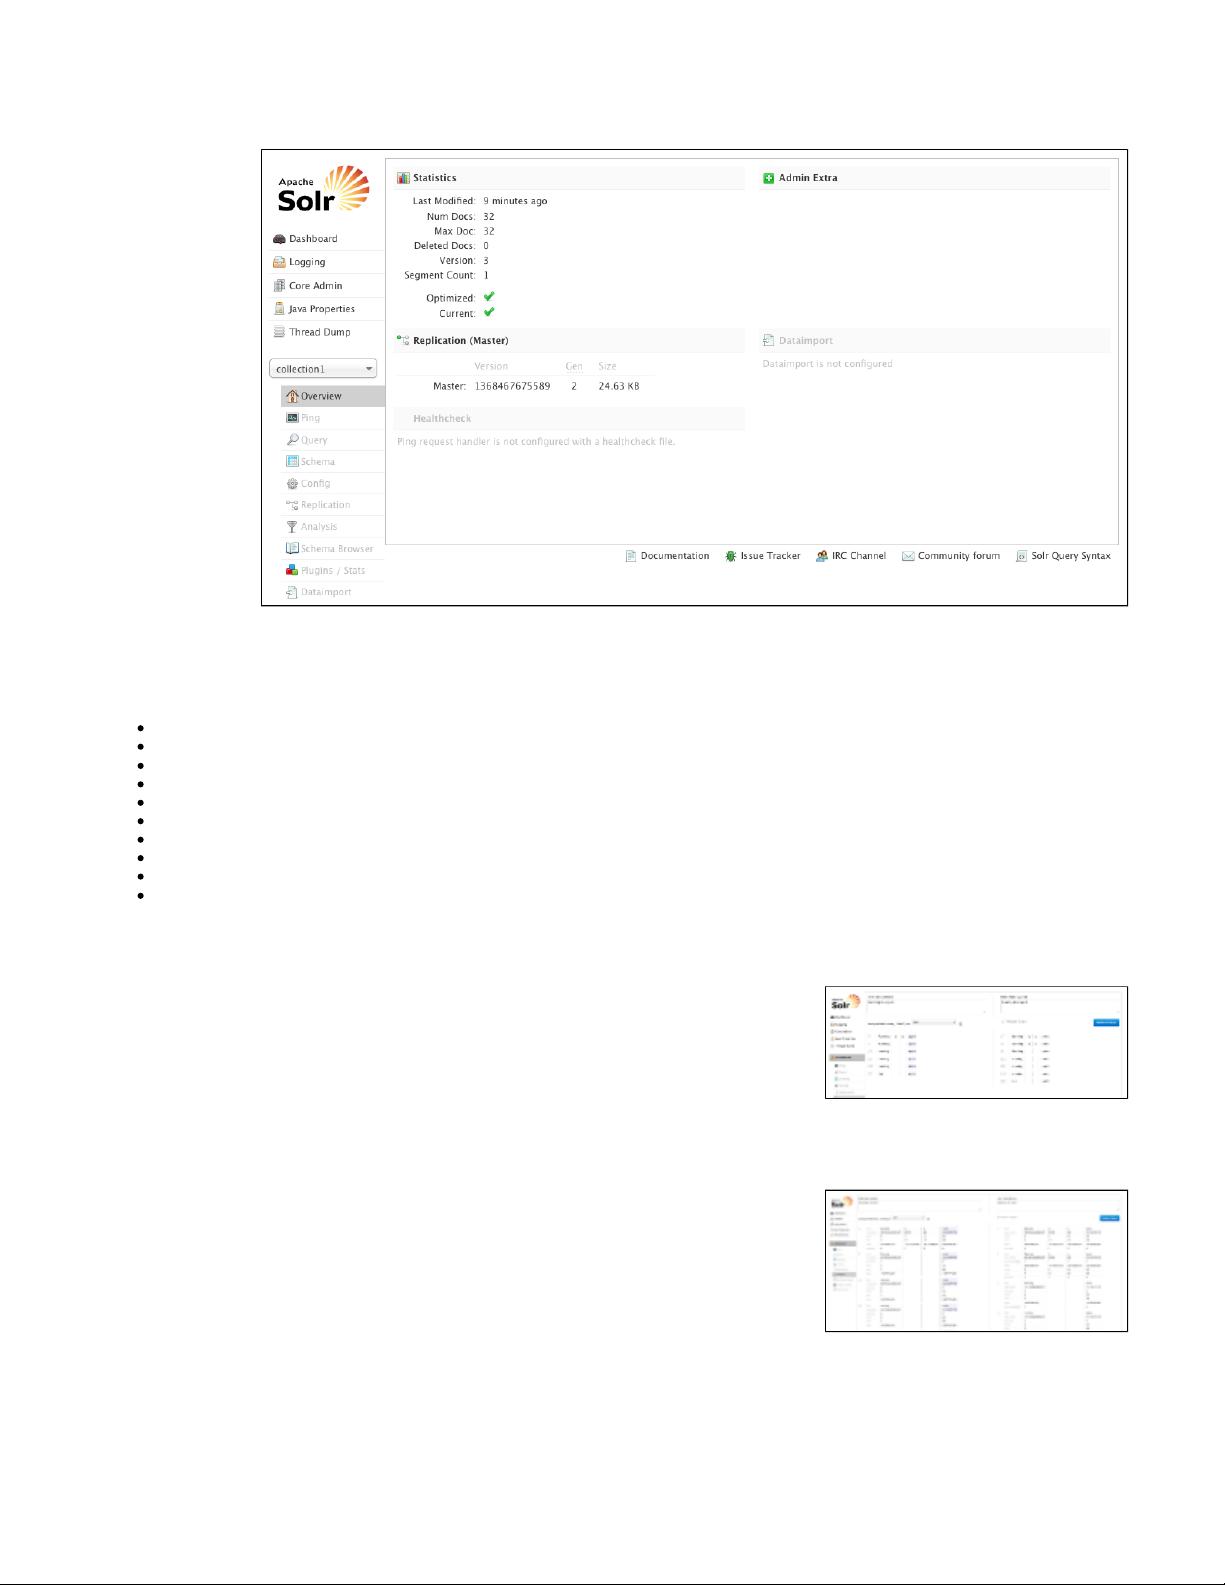
In the left-hand
navigation bar, you will
see a pull-down menu
titled "Core Selector".
Clicking on the menu
will show a list of Solr
cores, with a search
box that can be used
to find a specific core
(handy if you have a
lot of cores). When you
select a core, such as
in thecollection1
example, a secondary
menu opens under the
core name with the
administration options
available for that
particular core.
After selecting the
core, the central part of
the screen shows
Statistics and other
information about the
core you chose. You can define a file called that includes links or other information you would like to display in the "Adminadmin-extra.html
Extra" part of this main screen.
On the left side, under the core name, are links to other screens that display information or provide options for the specific core chosen. The
core-specific options are listed below, with a link to the section of this Guide to find out more:
Analysis - lets you analyze the data found in specific fields.
Config - shows the current configuration of the file for the core.solrconfig.xml
Dataimport - shows you information about the current status of the Data Import Handler.
Documents - provides a simple form allowing you to execute various Solr indexing commands directly from the browser.
Ping - lets you ping a named core and determine whether the core is active.
Plugins/Stats - shows statistics for plugins and other installed components.
Query - lets you submit a structured query about various elements of a core.
Replication - shows you the current replication status for the core, and lets you enable/disable replication.
Schema - describes the file for the core.schema.xml
Schema Browser - displays schema data in a browser window.
Analysis Screen
The Analysis screen lets you inspect how data will be handled according to the field, field type and
dynamic rule configurations found in . You can analyze how content would be handledschema.xml
during indexing or during query processing and view the results separately or at the same time. Ideally,
you would want content to be handled consistently, and this screen allows you to validate the settings
in the field type or field analysis chains.
Enter content in one or both boxes at the top of the screen, and then choose the field or field type
definitions to use for analysis.
The standard output (shown if "Verbose Output" is not checked) will display the step of the analysis and the output based on the current settings.
If you click the check box, you see more information, including transformations to the input (such as, convert to lower case, stripVerbose Output
extra characters, etc.) and the bytes, type and detailed position information. The information displayed
will vary depending on the settings of the field or field type. Each step of the process is displayed in a
separate section, with an abbreviation for the tokenizer or filter that is applied in that step. Hover or
click on the abbreviation, and you'll see the name and path of the tokenizer or filter.
In the examples on the right (click either screenshot for a larger image), several transformations are
applied to the text string "Running is a sport." We've used the field "text", which has rules that remove
the "is" and "a" and the word "running" has been changed to its basic form, "run". This is because we
have defined the field type, in this scenario, to remove stop words (small words that usually do not provide a great deal of context) andtext_en
"stem" terms when possible to find more possible matches (this is particularly helpful with plural forms of words). If you click the question mark
next to the pull-down menu, the Schema Browser window will open, showing you the settings for the fieldAnalyze Fieldname/Field Type
specified.
The section describes in detail what each option is and how it may transform your data.Understanding Analyzers, Tokenizers, and Filters


