"第六章 图形处理功能简单绘图举例"
需积分: 0 97 浏览量
更新于2024-01-21
收藏 280KB DOC 举报
Chapter 6: The Function of Image Processing
In the document "Some Data - Chapter 6: The Function of Image Processing", various two-dimensional plotting functions are discussed. This includes basic plotting functions such as Plot, semilogx, semilogy, loglog, polar, and plotyy.
The chapter covers the plotting of single vectors, where the elements of a vector are plotted against their index in a linear coordinate system. It provides examples of how to plot a single vector, with annotations and grid lines added to the graph for clarity. Additionally, the document explains how to plot double vectors, where two vectors of the same length are plotted together to show the relationship between their elements.
Through the examples and explanations provided in the document, readers can learn how to effectively utilize these plotting functions to visualize and analyze two-dimensional data. The chapter provides a comprehensive overview of the capabilities of MATLAB's image processing functions, allowing users to gain a deeper understanding of how to manipulate and display graphical data.
Overall, "Some Data - Chapter 6: The Function of Image Processing" serves as a valuable resource for individuals looking to enhance their skills in graphical data analysis and visualization using MATLAB. With its clear explanations and practical examples, the document equips readers with the knowledge and tools needed to make the most of MATLAB's image processing functions.
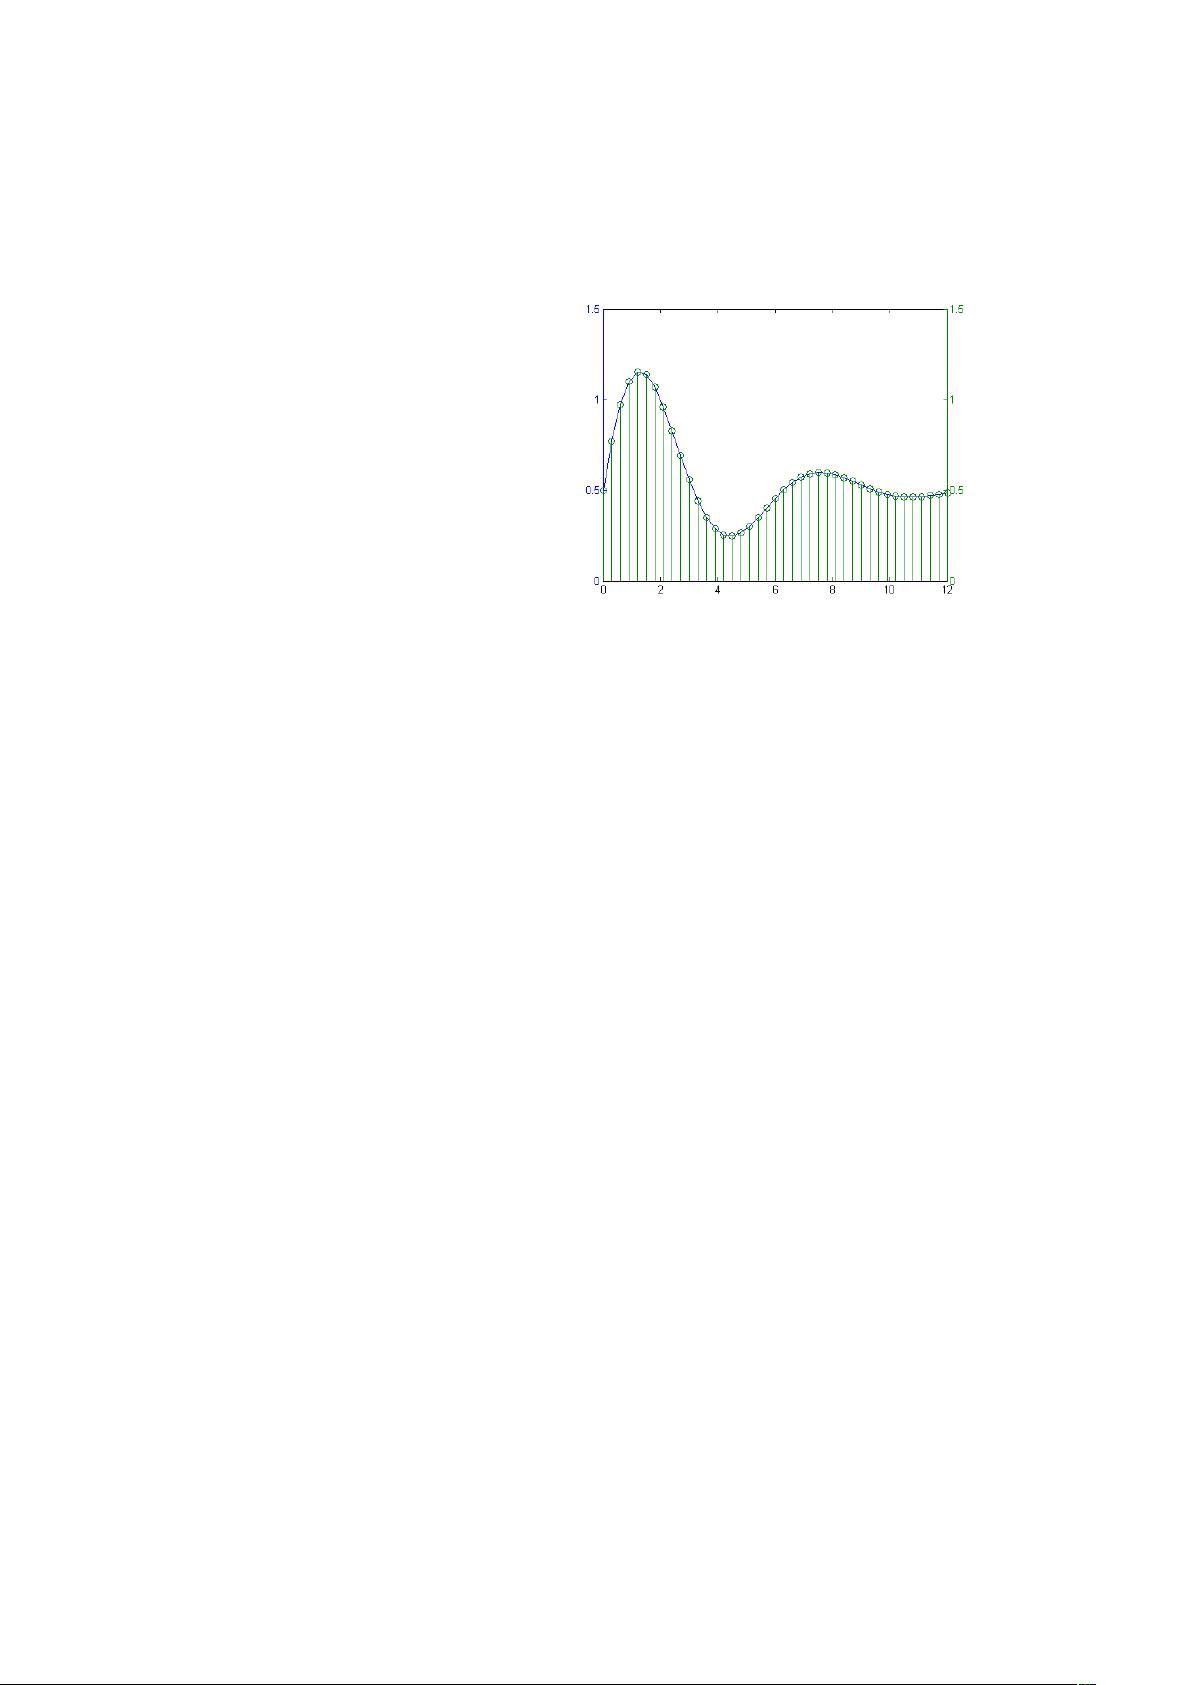
个 y 轴。两条图线可以调用不同的绘图方法。
例 1:
x=0:0.3:12;
y=exp(-0.3*x).*sin(x)+0.5;
plotyy(x,y,x,y,'plot','stem')
左侧 y 轴对应 plot 形式的绘图,右侧 y 轴对应 stem 形式的曲线。
例 2: 对于 y 坐标不同的情况。
t=0:900;
A=1000;
a=0.005;
b=0.005;
z1=A*exp(-a*t);
z2=sin(b*t);
plotyy(t,z1,t,z2,'semilogy','plot')
3. 图线形式和颜色(Style and color of plot)
(1) 图线的形式: (style of plot)MATLAB 提供的四种线形,


剩余45页未读,继续阅读
2024-06-20 上传
2023-07-19 上传
2023-05-05 上传
2023-06-03 上传
2024-06-07 上传
2023-08-24 上传
2023-05-05 上传

weixin_39840924
- 粉丝: 494
- 资源: 1万+
 我的内容管理
展开
我的内容管理
展开


最新资源
- IPQ4019 QSDK开源代码资源包发布
- 高频组电赛必备:掌握数字频率合成模块要点
- ThinkPHP开发的仿微博系统功能解析
- 掌握Objective-C并发编程:NSOperation与NSOperationQueue精讲
- Navicat160 Premium 安装教程与说明
- SpringBoot+Vue开发的休闲娱乐票务代理平台
- 数据库课程设计:实现与优化方法探讨
- 电赛高频模块攻略:掌握移相网络的关键技术
- PHP简易简历系统教程与源码分享
- Java聊天室程序设计:实现用户互动与服务器监控
- Bootstrap后台管理页面模板(纯前端实现)
- 校园订餐系统项目源码解析:深入Spring框架核心原理
- 探索Spring核心原理的JavaWeb校园管理系统源码
- ios苹果APP从开发到上架的完整流程指南
- 深入理解Spring核心原理与源码解析
- 掌握Python函数与模块使用技巧
