GraphPad Prism v5.0统计分析指南
需积分: 34 195 浏览量
更新于2024-08-02
1
收藏 2.25MB PDF 举报
"GraphPad Prism v5.0.pdf"
GraphPad Prism是一款广泛用于生物医学、生命科学以及社会科学领域的数据分析和图形制作软件。该软件的版本为5.0,由GraphPad Software, Inc.于2007年发布,并保留所有版权。GraphPad Prism以其易用性和强大的统计分析功能著称,特别适合非专业统计人员进行科学数据的处理和可视化。
统计指南由GraphPad Software公司的创始人Harvey Motulsky撰写,旨在帮助用户理解统计测试的基本概念,以便选择合适的统计方法并正确解读结果。此指南不仅适用于使用GraphPad Prism的用户,即使使用其他统计软件的用户也能从中受益。
GraphPad Prism 5的功能包括:
1. 数据图形化:用户可以轻松创建各种类型的图表,如散点图、柱状图、线图、生存曲线等,以直观展示数据分布和趋势。
2. 统计分析:提供多种统计测试,如t检验、ANOVA、非参数检验、生存分析等,覆盖了一般科学研究中的常见分析需求。
3. 曲线拟合:配合配套的Regression Guide,用户可以学习如何使用Prism来拟合曲线,包括线性、非线性回归、剂量响应曲线等,便于研究变量间的关系。
4. 数据管理:方便地组织和管理实验数据,支持多列数据表,便于进行复杂的比较和分析。
5. 结果解释:通过清晰的报告模板,用户可以生成包含统计结果和图形的专业报告。
6. 自动化分析:Prism允许用户设置分析流程,自动执行一系列分析步骤,节省时间和精力。
7. 教程和帮助系统:提供的Statistics Guide和Regression Guide与软件内置的帮助系统同步,为用户提供详尽的使用指导。
GraphPad Prism 5是科学研究中一个强大而实用的工具,它简化了数据分析过程,使用户能够更加专注于科学研究本身,而不是复杂的统计计算。无论是初学者还是经验丰富的研究人员,都能通过这款软件提升数据分析的效率和准确性。
16
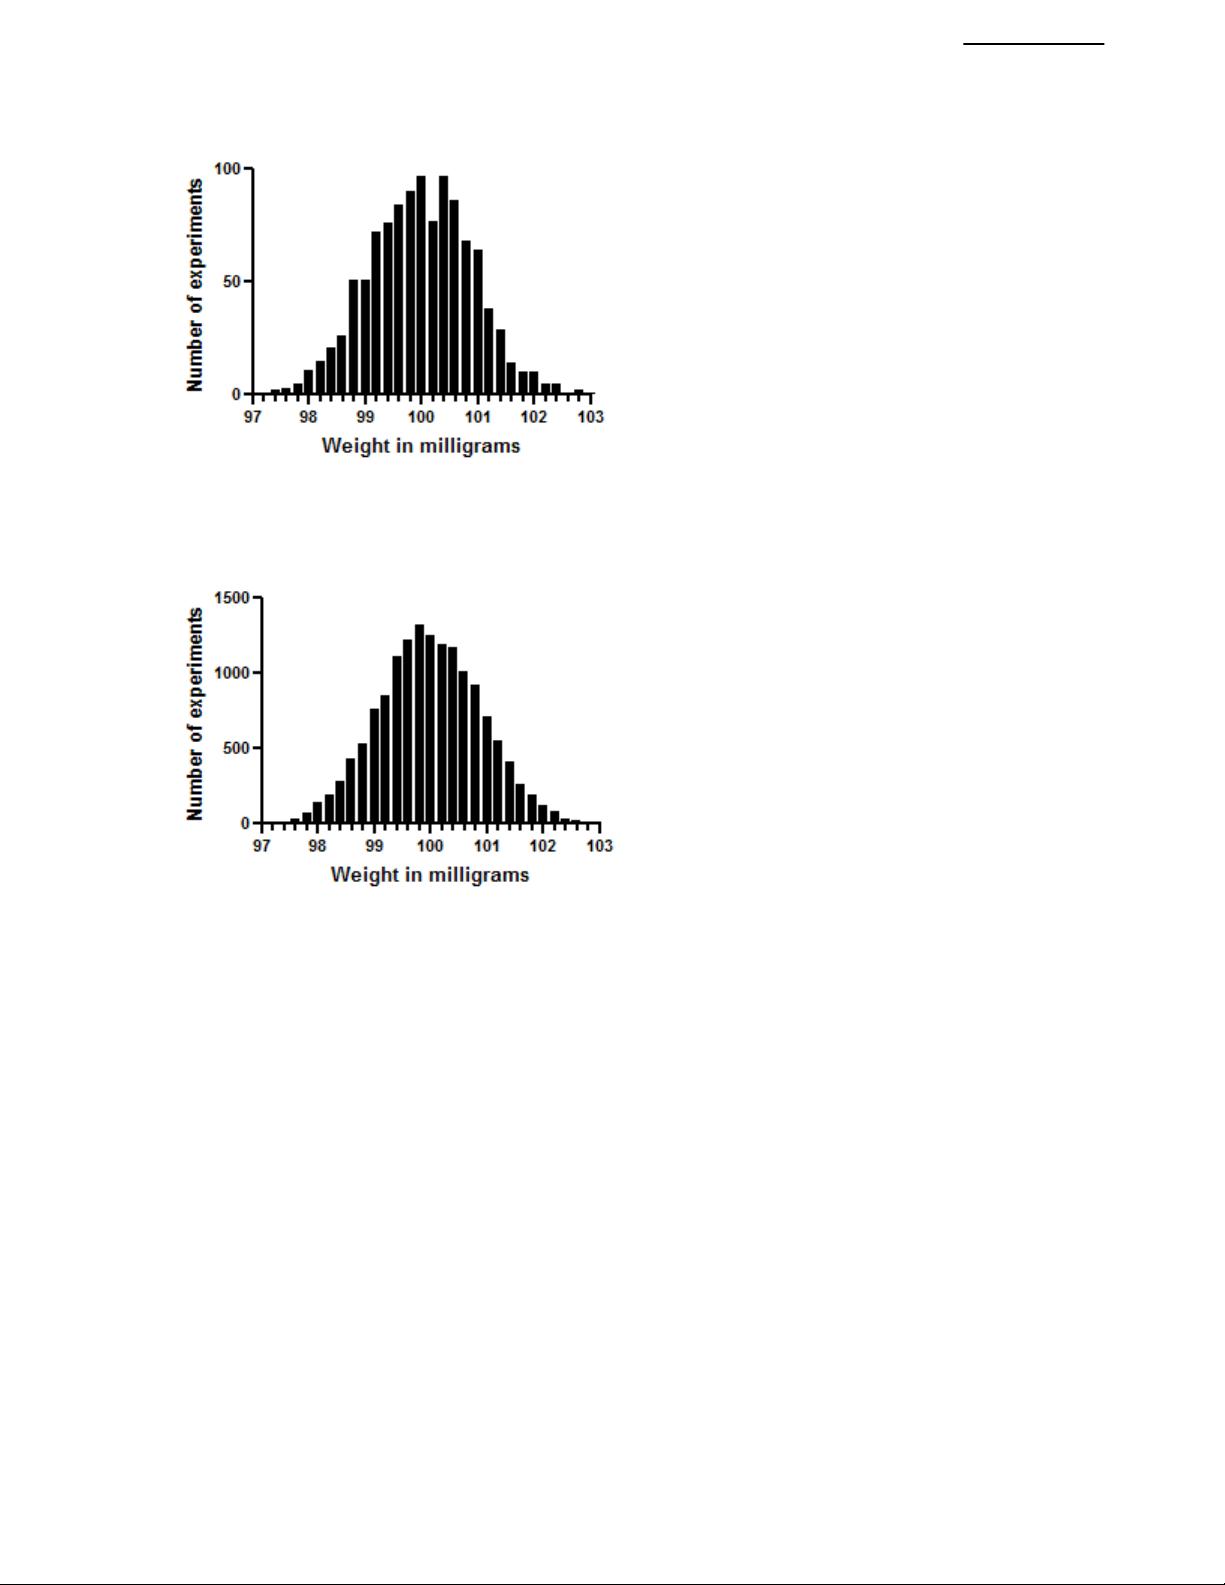
The Gaussian Distribution
© 2007 GraphPad Software, inc.
Prism 5 Statistics Guide
www.graphpad.com
The distribution looks a lot like an ideal Gaussian distribution. Repeat the experiment 15,000 times
rather than 1,000 and you get even closer to a Gaussian distribution.
This simulation demonstrates a principle that can also be mathematically proven. Scatter will
approximate a Gaussian distribution if your experimental scatter has numerous sources that are
additive and of nearly equal weight, and the sample size is large.
The Gaussian distribution is a mathematical ideal. Few biological distributions, if any, really follow
the Gaussian distribution. The Gaussian distribution extends from negative infinity to positive
infinity. If the weights in the example above really were to follow a Gaussian distribution, there
would be some chance (albeit very small) that the weight is negative. Since weights can't be
negative, the distribution cannot be exactly Gaussian. But it is close enough to Gaussian to make it
OK to use statistical methods (like t tests and regression) that assume a Gaussian distribution.


剩余254页未读,继续阅读
453 浏览量
2969 浏览量
204 浏览量
318 浏览量
928 浏览量
307 浏览量
205 浏览量
887 浏览量

QQ77QQ
- 粉丝: 1
 我的内容管理
展开
我的内容管理
展开


最新资源
- MATLAB在大学生数学建模竞赛中的应用研究
- Windows XP风格的333个GIF图标下载
- 利用GDScript进行指导性游戏开发:HoppyDays项目解析
- QCustomPlot 2.0.1版发布:图表绘制与PDF导出解决方案
- 数字电路技术第五版课后习题详解及答案
- 探索RTL1090软件:无线电爱好者的新选择
- 探索事实空间的可视化:使用JavaScript构建视觉世界
- Android API中文版查看教程
- AH计算器软件v4.13:傻瓜型语音表达式计算器
- NodeJS + MongoDB用户注册登录API实现指南
- MFC开发实践:FAT32文件分类器教程
- RGB到Lab颜色空间转换的Matlab实现
- 自定义状态栏颜色,修改状态栏背景与图标色
- MingQQ Android开源项目源代码解析
- 掌握Servlet技术实现文件上传及处理方法
- 手机社区网站仿百田圈圈模板设计与应用
