基于子模优化的多目标跟踪算法
下载需积分: 9 | PDF格式 | 2.42MB |
更新于2024-09-07
| 145 浏览量 | 举报
"Multiobject Tracking by Submodular Optimization.pdf"
这篇论文是关于多目标跟踪的,主要利用了次模优化的方法。作者团队包括IEEE的高级成员Jianbing Shen、Zhiyuan Liang、Jianhong Liu、Hanqiu Sun以及会员Ling Shao和IEEE的院士Dacheng Tao。文章已被接受发表在未来的期刊上,内容已经最终确定,除了页码外。
在多目标视觉跟踪中,提出的新算法分为两个主要阶段。首先,为了应对遮挡问题,他们设计了一种新的轨迹片段选择策略。这一阶段通过重叠标准和最小成本流分别生成低级轨迹片段,并将它们整合到候选轨迹片段集中。在第二阶段,他们将多目标跟踪问题形式化为受相关约束的次模最大化问题。次模函数用于从候选的轨迹片段集合中选择正确的片段,以构建物体的运动轨迹。接着,他们设计了一个连接过程,用以连接对应的轨迹,从而克服由于目标遮挡或短暂消失导致的跟踪断裂问题。
次模优化在组合优化中具有重要的地位,因为它能保证在选择元素时具有下减性质,即增加一个元素对整体价值的提升不会超过它在当前集合中的贡献。在多目标跟踪场景中,这一特性使得算法能够在众多可能的轨迹片段中高效地选择最合适的序列,从而提高跟踪的准确性和鲁棒性。
论文中提到的算法可能包括以下几个关键步骤:首先,通过某种启发式方法生成初步的轨迹片段;其次,利用次模函数来评估这些片段的重要性并进行选择;最后,采用有效的连接策略修复可能存在的断裂,确保轨迹的连贯性。这样的方法对于处理复杂视觉环境中的多目标跟踪挑战,如目标重叠、快速运动、光照变化等,都具有显著的优势。
这篇论文提出的多目标跟踪算法通过引入次模优化,提供了一种新颖且有效的方式来处理视觉跟踪中的遮挡和断裂问题,提高了跟踪算法的性能。这为多目标跟踪领域的研究提供了新的思路和潜在的技术改进方向。
This article has been accepted for inclusion in a future issue of this journal. Content is final as presented, with the exception of pagination.
SHEN et al.: MOT BY SUBMODULAR OPTIMIZATION 3
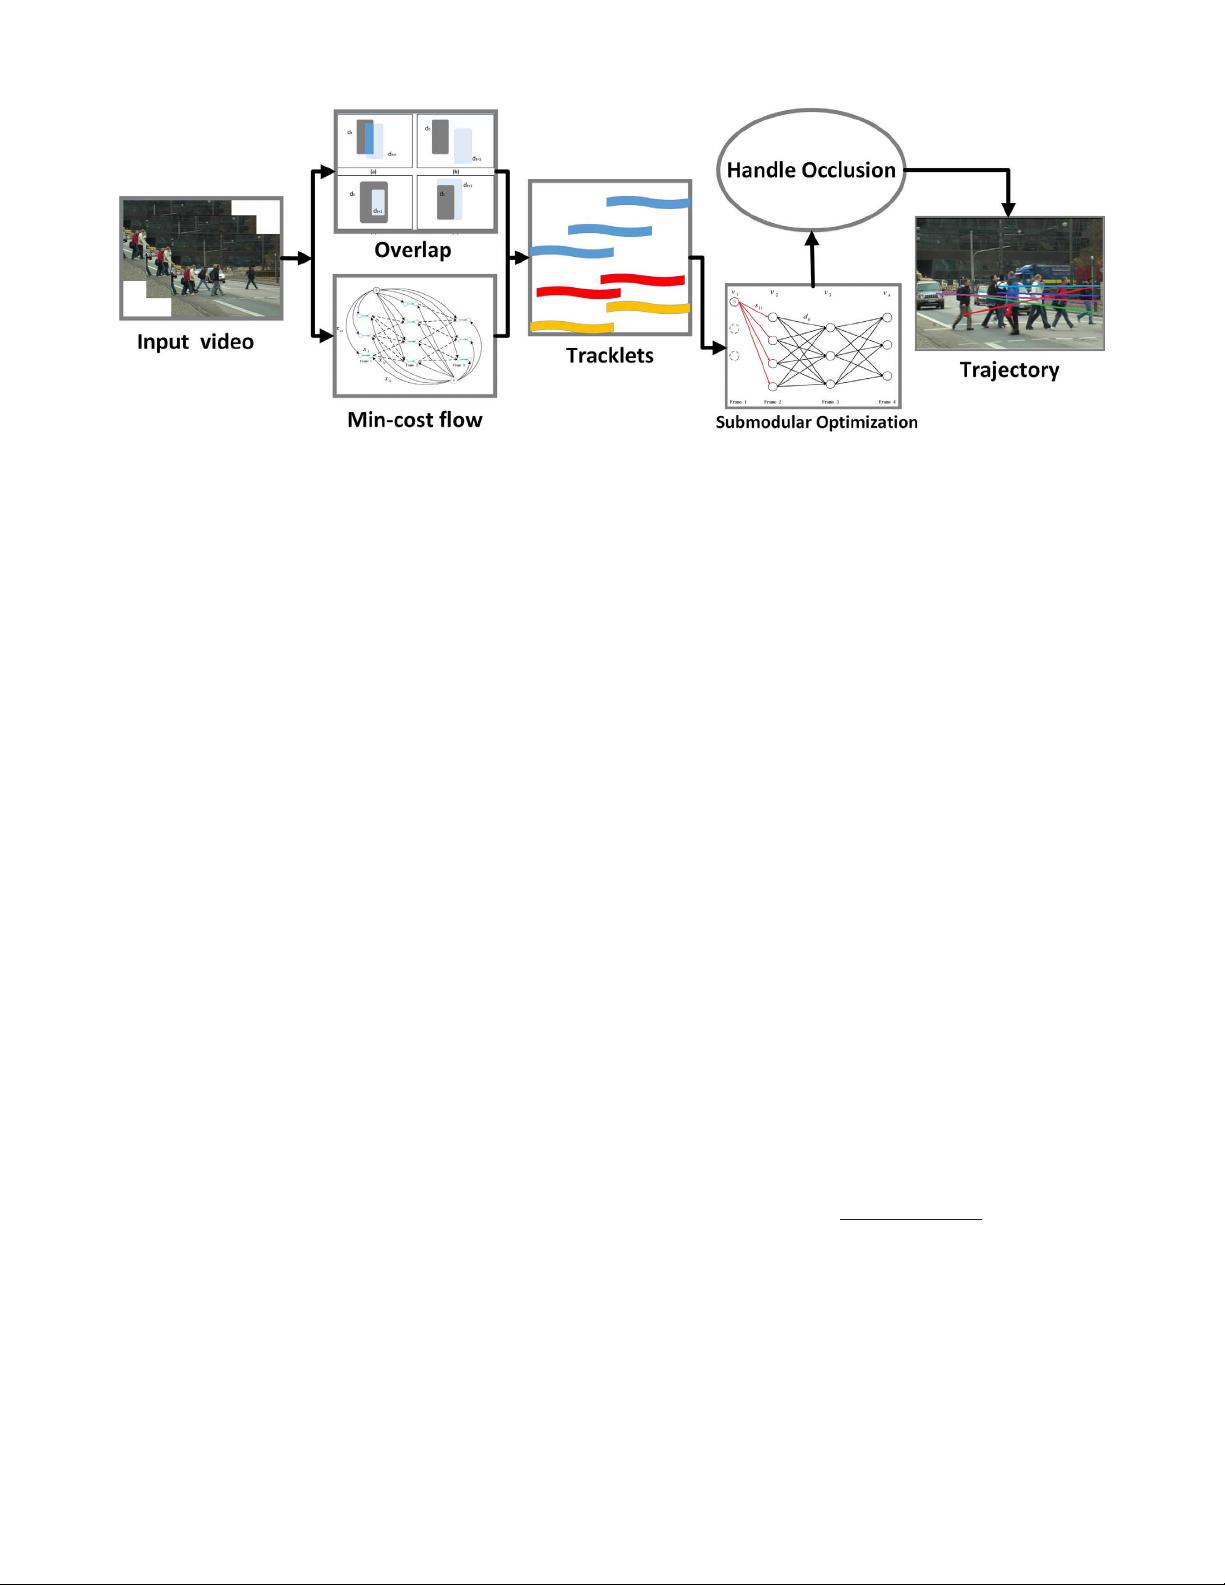
Fig. 2. Flowchart of our MOT algorithm. First, we generate tracklets by overlap criteria and min-cost flow, respectively. Then, we formulate the MOT
problem as the maximization of a submodular optimization problem, where handling occlusion is also incorporated into our framework.
Zamir et al. [14] generated the tracklets of pedestrians using a
global method. The method in [15] only relies on spatial char-
acteristics between detections, and it lacks robustness when
detections are too close with each other in space. Tracklets by
Zamir et al. [14] exploit the appearance features in a batch of
video frames. However, appearance cues are not sufficient to
discriminate multiple objects, especially for tracking objects
with similar appearances. In this paper, we first adopt intu-
itive overlap criteria on detections to obtain reliable tracklets.
Then, a network flow model is built to generate another kind
of tracklets. We incorporate these two kinds of tracklets into
our submodular optimization as a new selection process.
Another group of important related works are the submod-
ular optimization approaches for image and video processing.
Submodularity has been applied to many vision tasks, such
as video summarization [22], detection [24], object recogni-
tion [25], and clustering [26]. Liu et al. [26] presented the
entropy rate of random walk on a graph for compact and
homogeneous clustering. Jiang and Davis [24] solved a facility
location problem for salient region detection by maximizing
a submodular objective function. Submodular maximization
solves many important problems including certain constraint
satisfaction problems and maximum facility location prob-
lems. In our framework, we formulate the MOT problem as a
submodular optimization problem. A submodular function is
designed to pick the correct tracklets from the candidate set
of tracklets, and these tracklets can constitute the final target
trajectory.
III. O
UR TRACKING APPROACH
The flowchart of our MOT algorithm is given in Fig. 2.
The first step detects the pedestrians in each frame. We use the
object detections provided by the MOTChallenge2015 dataset.
Next, we divide the input sequence into a number of video
segments and find the low-level tracklets, where each video
segment contains ten frames. Two strategies are used to create
the low-level tracklets. Then the low-level tracklets in differ-
ent segments are used as the input to generate trajectories.
We propose a data association model that can be solved by
a submodular function to connect the low-level tracklets and
generate the final trajectories. The final step is to optimize our
trajectory result and solve the occlusion problem.
A. Finding Low-Level Tracklets
In this section, we describe how to get the low-level track-
lets. We divide an input video into K segments of ten frames
each. Then we adopt two data association methods to find
tracklets and then incorporate these tracklets into our sub-
modular optimization framework. Tracklets have been used as
reliable inputs in many previous works which can reduce the
computational complexity and noise. In this paper, we incor-
porate appearance and motion similarity between different
tracklets into our cost function.
1) Overlap Criteria Method: An intuitive overlap criterion
is used in this paper to connect bounding boxes between con-
secutive frames according to their overlap ratio just like [15].
Fig. 3 shows the overlap of two detections d
t
and d
t+1
from
consecutive frames t and t + 1, respectively. There are four
situations including partial overlap and complete overlap for
these two detections. Detections d
t
and d
t+1
have an over-
lapped part in Fig. 3(a), and they do not have overlaps in
Fig. 3(b). Fig. 3(c) and (d) shows that one detection contains
another one. In general, we calculate the value of an overlap
region as follows:
V
overlap
=
S
share
S
t
+ S
t+1
− S
share
(1)
where S
share
means the common area of two detections and S
t
and S
t+1
represent the areas of detections d
t
and d
t+1
, respec-
tively. And the value of V
overlap
measures the percentage of
the common area of corresponding detections. As shown in
Fig. 3(b), when two detections d
t
and d
t+1
are apart in spa-
tial domain, V
overlap
equals to 0, which means they are little
likely to be part of the same target. Finally, we connect two
detections as a tracklet if V
overlap
> 0.6.
This method relies on the spatial characteristics between
detections in consecutive frames. If two detections which
剩余11页未读,继续阅读
相关推荐


大白菜丫丫
- 粉丝: 73
 我的内容管理
展开
我的内容管理
展开


最新资源
- 帧中继技术要点与NP帧中继实践笔记分享
- 安装指南:torch_sparse-0.6.12 for Windows with CUDA支持
- Java五子棋游戏代码及其开发心得分享
- Ruby ripl-misc 插件开发:创意与实践
- 深入探讨React与TypeScript的结合应用
- 通信原理课件,易学易懂,考试必备
- Android开发面试题汇总:助你71问高薪无忧
- SSHE项目源码:基于EasyUI和SSH的权限管理框架
- PyTorch Sparse 0.6.12版本兼容指南及安装要求
- 新浪Appkey申请教程:无限制使用指南
- Delphi聊天程序:多人使用界面华丽
- Rebus: Erlang 实现的轻量级 PubSub 事件总线
- Scala编程示例源代码大全
- 大气Excel财务会计简历模板下载
- 加载Milkshape 3D模型与JPEG纹理教程
- GitHub Pages个人网站博客迁移指南:从HTTPS到satharus.github.io
