利用Intel Pin打造定制化程序分析工具有方
需积分: 50 43 浏览量
更新于2024-09-08
收藏 294KB PDF 举报
"《使用Pin构建定制的程序分析工具》是一篇介绍Intel Pin动态编译器技术的文章,由Chi-Keung Luk, Robert Cohn, Robert Muth, Harish Patil, Artur Klauser, Geoff Lowney, Steven Wallace, Vijay Janapa Reddi(†)以及Kim Hazelwood等专家合作完成,代表了Intel Corporation。Pin是一种强大的二进制插桩工具,特别针对软件分析任务如性能评估、调试和故障检测需求而设计。
文章的核心内容涵盖了以下几个方面:
1. 工作原理:Pin通过遵循ATOM模型运作,允许开发者在无需详细了解底层指令集的情况下,对应用程序进行低级别的指令级分析。这种设计使得Pin工具具有高度灵活性和透明度。
2. 基本使用方法:Pin工具是用C/C++编写的,利用其丰富的应用程序编程接口(API)。这使得开发人员能够轻松地集成和定制自己的分析逻辑。
3. 架构独立性:Pin API被设计成尽可能地跨平台兼容,使得同一个Pintool可以在不同的处理器架构上运行,增强了工具的通用性和移植性。
4. 性能比较与优化:文章还探讨了Pin与其他插桩工具的性能对比,强调了Pin在效率方面的优势,并提供了在不同硬件平台上进行性能调优的策略。
5. 适用领域:Pin适用于各种软件分析场景,包括但不限于代码审查、性能瓶颈检测、安全审计等。
6. 资源链接:文章最后提供了Pin的官方网站http://rogue.colorado.edu/Pin和项目邮箱pin.project@intel.com,以便读者获取更多关于Pin的最新资料和社区支持。
对于非英语读者,虽然文章是英文版,但通过翻译工具可以方便理解,这对于那些需要进行深入系统分析和定制工具的开发者来说,是一项极具价值的技术指南。"
这篇技术文档为IT专业人士提供了一套强大的分析工具构建体系,对于那些追求高效、灵活和跨平台的程序分析实践者来说,无疑是一份不可多得的参考资料。
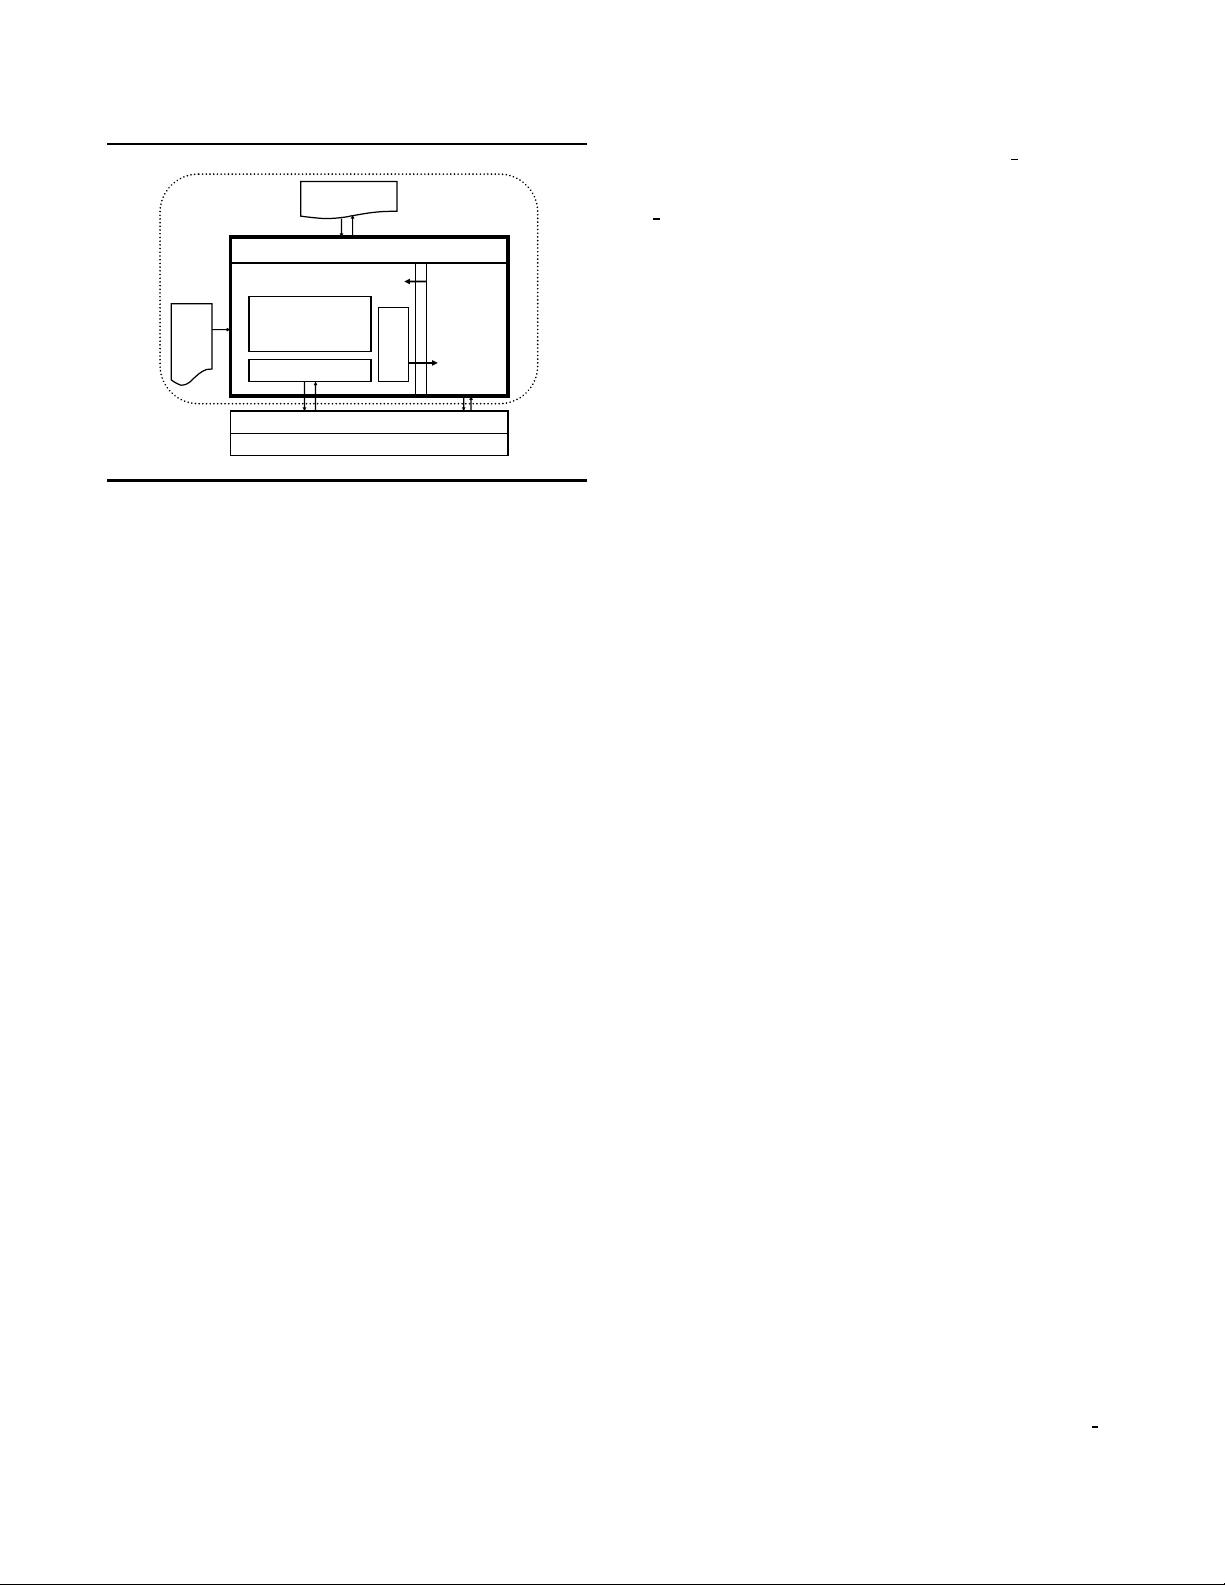
JIT Compiler
Emulation Unit
Dispatcher
Virtual Machine (VM)
Code
Cache
Instrumentation APIs
Application
Operating System
Hardware
Pin
Pintool
Address Space
Figure 2. Pin’s software architecture
mentation API invoked by Pintools. The VM consists of a just-in-
time compiler (JIT), an emulator, and a dispatcher. After Pin gains
control of the application, the VM coordinates its components to
execute the application. The JIT compiles and instruments applica-
tion code, which is then launched by the dispatcher. The compiled
code is stored in the code cache. Entering/leaving the VM from/to
the code cache involves saving and restoring the application register
state. The emulator interprets instructions that cannot be executed
directly. It is used for system calls which require special handling
from the VM. Since Pin sits above the operating system, it can only
capture user-level code.
As Figure 2 shows, there are three binary programs present
when an instrumented program is running: the application, Pin, and
the Pintool. Pin is the engine that jits and instruments the applica-
tion. The Pintool contains the instrumentation and analysis routines
and is linked with a library that allows it to communicate with Pin.
While they share the same address space, they do not share any li-
braries and so there are typically three copies of glibc. By making
all of the libraries private, we avoid unwanted interaction between
Pin, the Pintool, and the application. One example of a problematic
interaction is when the application executes a glibc function that
is not reentrant. If the application starts executing the function and
then tries to execute some code that triggers further compilation, it
will enter the JIT. If the JIT executes the same glibc function, it
will enter the same procedure a second time while the application
is still executing it, causing an error. Since we have separate copies
of glibc for each component, Pin and the application do not share
any data and cannot have a re-entrancy problem. The same prob-
lem can occur when we jit the analysis code in the Pintool that
calls glibc (jitting the analysis routine allows us to greatly reduce
the overhead of simple instrumentation on Itanium).
3.2 Injecting Pin
The injector loads Pin into the address space of an application. In-
jection uses the Unix Ptrace API to obtain control of an application
and capture the processor context. It loads the Pin binary into the
application address space and starts it running. After initializing
itself, Pin loads the Pintool into the address space and starts it run-
ning. The Pintool initializes itself and then requests that Pin start
the application. Pin creates the initial context and starts jitting the
application at the entry point (or at the current PC in the case of
attach). Using Ptrace as the mechanism for injection allows us to
attach to an already running process in the same way as a debug-
ger. It is also possible to detach from an instrumented process and
continue executing the original, uninstrumented code.
Other tools like DynamoRIO [6] rely on the LD
PRELOAD en-
vironment variable to force the dynamic loader to load a shared li-
brary in the address space. Pin’s method has three advantages. First,
LD
PRELOAD does not work with statically-linked binaries, which
many of our users require. Second, loading an extra shared library
will shift all of the application shared libraries and some dynami-
cally allocated memory to a higher address when compared to an
uninstrumented execution. We attempt to preserve the original be-
havior as much as possible. Third, the instrumentation tool cannot
gain control of the application until after the shared-library loader
has partially executed, while our method is able to instrument the
very first instruction in the program. This capability actually ex-
posed a bug in the Linux shared-library loader, resulting from a
reference to uninitialized data on the stack.
3.3 The JIT Compiler
3.3.1 Basics
Pin compiles from one ISA directly into the same ISA (e.g., IA32
to IA32, ARM to ARM) without going through an intermediate
format, and the compiled code is stored in a software-based code
cache. Only code residing in the code cache is executed—the origi-
nal code is never executed. An application is compiled one trace at
a time. A trace is a straight-line sequence of instructions which ter-
minates at one of the conditions: (i) an unconditional control trans-
fer (branch, call, or return), (ii)a pre-defined number of conditional
control transfers, or (iii) a pre-defined number of instructions have
been fetched in the trace. In addition to the last exit, a trace may
have multiple side-exits (the conditional control transfers). Each
exit initially branches to a stub, which re-directs the control to the
VM. The VM determines the target address (which is statically un-
known for indirect control transfers), generates a new trace for the
target if it has not been generated before, and resumes the execution
at the target trace.
In the rest of this section, we discuss the following features of
our JIT: trace linking, register re-reallocation, and instrumentation
optimization. Our current performance effort is focusing on IA32,
EM64T, and Itanium, which have all these features implemented.
While the ARM version of Pin is fully functional, some of the
optimizations are not yet implemented.
3.3.2 Trace Linking
To improve performance, Pin attempts to branch directly from a
trace exit to the target trace, bypassing the stub and VM. We
call this process trace linking. Linking a direct control transfer
is straightforward as it has a unique target. We simply patch the
branch at the end of one trace to jump to the target trace. However,
an indirect control transfer (a jump, call, or return) has multiple
possible targets and therefore needs some sort of target-prediction
mechanism.
Figure 3(a) illustrates our indirect linking approach as imple-
mented on the x86 architecture. Pin translates the indirect jump
into a move and a direct jump. The move puts the indirect target
address into register %edx (this register as well as the %ecx and
%esi shown in Figure 3(a) are obtained via register re-allocation,
as we will discuss in Section 3.3.3). The direct jump goes to the
first predicted target address 0x40001000 (which is mapped to
0x70001000 in the code cache for this example). We compare
%edx against 0x40001000 using the lea/jecxz idiom used in Dy-
namoRIO [6], which avoids modifying the conditional flags reg-
ister eflags. If the prediction is correct (i.e. %ecx=0), we will
branch to match1 to execute the remaining code of the predicted
target. If the prediction is wrong, we will try another predicted tar-
get 0x40002000 (mapped to 0x70002000 in the code cache). If the
target is not found on the chain, we will branch to LookupHtab
1,
which searches for the target in a hash table (whose base address is
192
剩余10页未读,继续阅读
586 浏览量
2022-05-08 上传
134 浏览量
395 浏览量
点击了解资源详情
点击了解资源详情

flydream3618
- 粉丝: 34
 我的内容管理
展开
我的内容管理
展开


最新资源
- Servlet核心技术与实践:从基础到高级
- Servlet核心技术详解:从基础到过滤器与监听器
- 操作系统实验:进程调度与优先数算法
- 《Div+CSS布局大全》教程整理
- 创建客户反馈表单的步骤
- Java容器深度解析:Array、List、Set与Map
- JAVA字符集与编码转换详解
- 华为硬件工程师的手册概览
- ASP.NET 2.0 实现动态广告管理与随机显示
- 使用Dreamweaver创建网页过渡动画效果
- 创建ASP登录系统:步骤详解
- ASP论坛搭建:资料转义与版主权限管理
- C#新手必读:新版设计模式详解与实例
- 提升网站论坛制作:技术优化与点击计数
- AVR微处理器ATmega32L/32:高级特性和功能详解
- C++实现经典矩阵:螺旋及蛇形排列
