DB2 Version 9 Visual Explain教程:Linux与Windows版学习指南
需积分: 8 101 浏览量
更新于2024-08-02
收藏 1.11MB PDF 举报
本教程是针对DB2 Version 9的Visual Explain详解指南,主要适用于Linux和Windows操作系统。DB2 Version 9是一款强大的关系型数据库管理系统,其Visual Explain工具是理解查询性能的关键组件。该教程旨在帮助用户深入了解如何利用Visual Explain来优化查询计划,以便提高数据库操作的效率和响应速度。
Visual Explain是DB2中的一个功能,它允许用户在执行SQL语句之前预览其执行计划,这有助于识别可能存在的性能瓶颈和潜在的优化机会。通过这个工具,开发人员可以观察到查询的各个阶段,包括表扫描、索引使用、排序、连接操作等,从而更好地理解和调整查询逻辑,确保查询的高效执行。
在使用本教程前,请务必阅读附带的“注意事项”部分,其中包括版权声明和许可协议,以及关于产品保修和声明的澄清。教程内容可能不包含产品保修,并且任何手册中的陈述都不能视为保修承诺。用户可以通过IBM官方网站(www.ibm.com/shop/publications/)在线订购IBM出版物,或通过全球IBM联系人目录(www.ibm.com/planetwide)找到本地代表进行购买。
对于美国和加拿大的用户,可以直接拨打1-800-IBM-4YOU (426-4968)与DB2营销和销售团队联系订购相关的DB2文档。本教程提供了一个深入学习和实践Visual Explain技巧的基础,无论是初次接触DB2的开发人员,还是希望提升查询性能优化技能的专业人士,都将从中受益匪浅。
通过DB2 Version 9的Visual Explain教程,读者将学会如何有效地利用该工具分析SQL语句,理解其背后的执行逻辑,以及如何据此进行优化,以实现更高效的数据库管理。这是一项必备的技能,对于任何处理大量数据并追求性能优化的IT专业人员来说,都是一份不可或缺的学习资料。

To view details for multiple operators, select each one by clicking on it (it is
highlighted); then select Node–>Show Details. A Statistics window opens
for each of the selected objects. (The windows might be stacked and some
dragging and dropping could be required in order to access them all.)
Getting statistics for functions:
To view catalog statistics for built-in functions and user-defined functions,
select Statement–>Show Statistics–>Functions;. Select one or more entries
from the list displayed on the Functions window and click OK. A Function
Statistics window opens for each of the selected functions.
Getting statistics for tables spaces:
To view catalog statistics for table spaces, select Statement–>Show
Statistics–>Table Spaces. Select one or more entries from the list displayed
on the Table Spaces window and click on OK. A Table Space Statistics
window opens for each of the selected table spaces.
Getting statistics for columns in an SQL or XQuery statement:
To view statistics for the columns referenced in an SQL or XQuery
statement, double-click a table in the access plan graph. The Table Statistics
window opens. Click the Referenced Columns push button. The
Referenced Columns window opens, listing the columns in the table. Select
one or more columns from the list, and click OK. A Referenced Column
Statistics window opens for each of the columns selected.
Getting information about configuration parameters and bind options:
To view information about configuration parameters and bind options
(optimization parameters), select Statement–>Show Optimization
parameters from the Access Plan Graph window. The Optimization
Parameters window opens, displaying information about the parameter
values that were in effect at the time the snapshot was created, as well as
the current values.
Related concepts:
v “Access plan graph node” on page 49
v “Predicate” on page 55
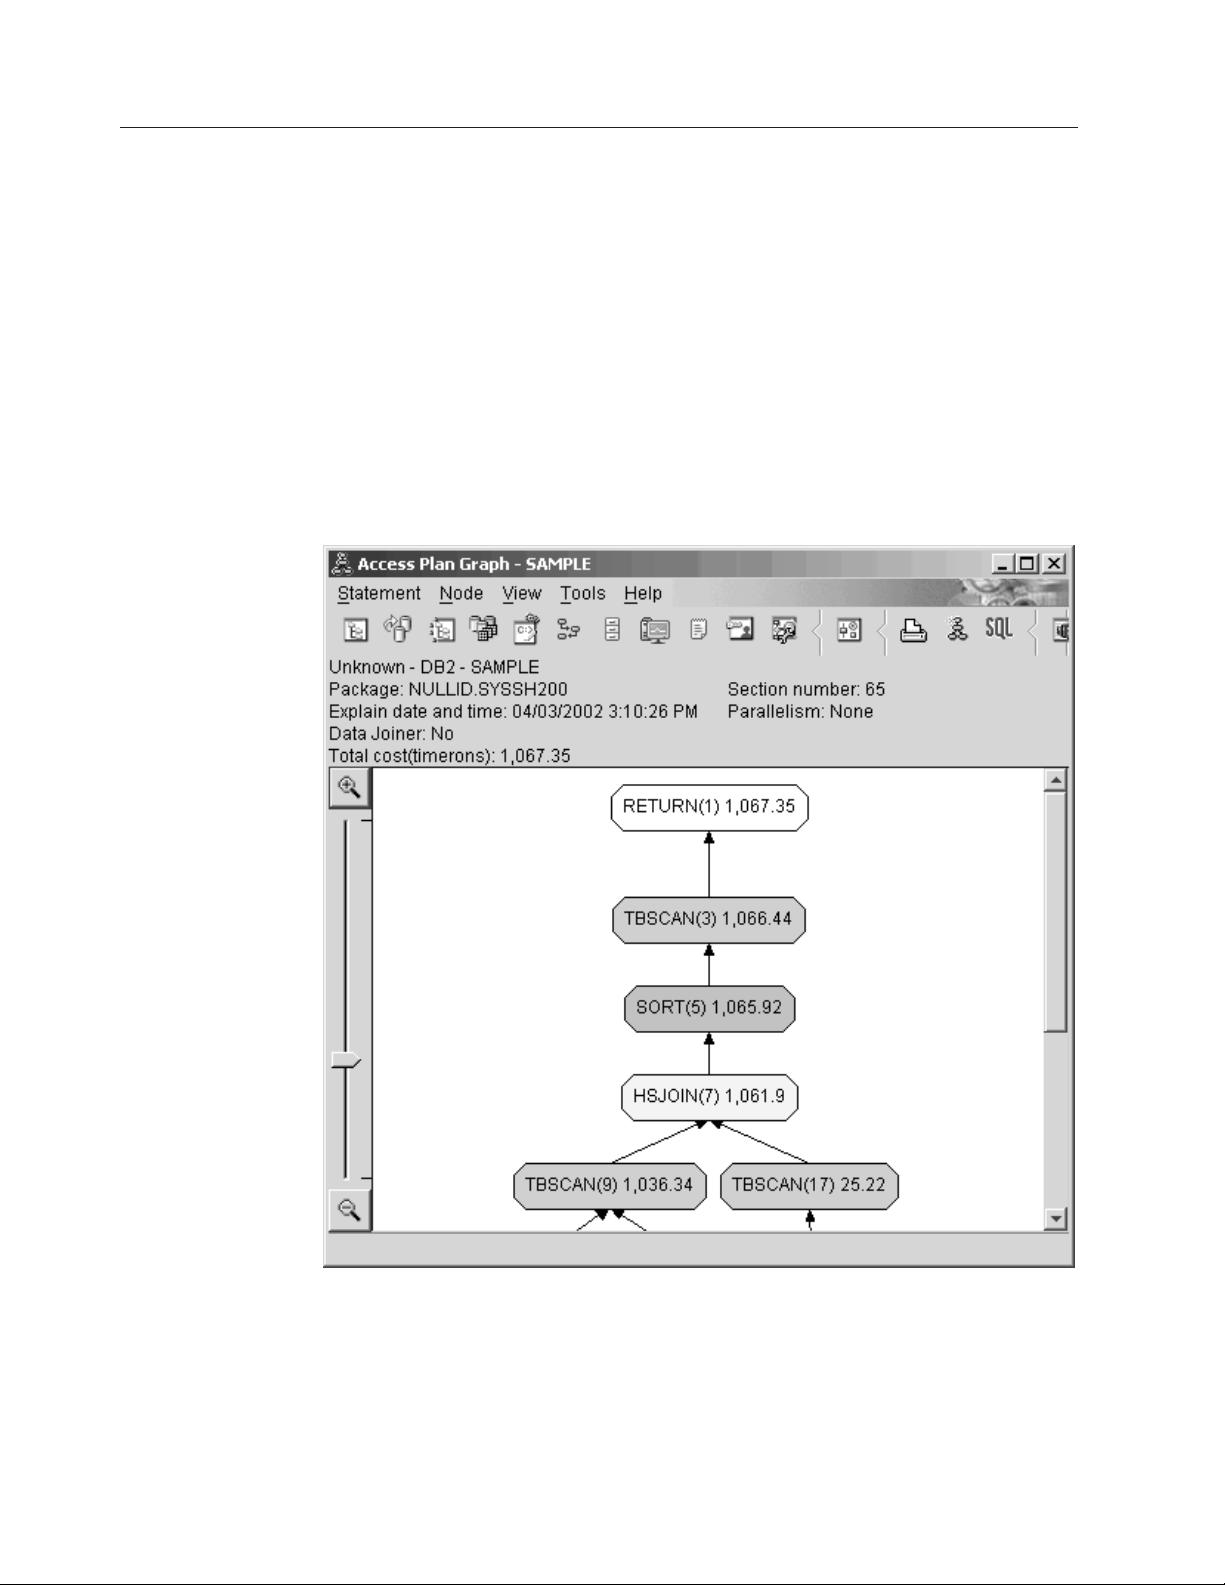
Changing the appearance of a graph
To change various characteristics of how a graph appears:
1. From the Access Plan Graph window, select View–>Settings. The the Access
Plan Graph Settings notebook opens.
2. To change the background color, choose the Graph tab.
3. To change the color of various operators, use the Basic, Extend, Update, and
Miscellaneous tabs.
4. To change the color of table, index, or table function nodes, select the Operand
tab.
5. To specify which type of information is shown in operator nodes (type of cost
or cardinality, which is the estimated number of rows returned so far), choose
the Operator tab.
6. To specify whether schema names or user IDs are shown in table nodes, select
the Operand tab.
10 Visual Explain Tutorial


剩余97页未读,继续阅读
2019-04-13 上传
2009-09-08 上传
2011-03-19 上传
2023-08-16 上传
2024-04-20 上传
2024-04-04 上传
2023-08-04 上传
2023-06-11 上传
2023-12-29 上传

johncheung2004
- 粉丝: 0
- 资源: 1
 我的内容管理
展开
我的内容管理
展开


最新资源
- Accuinsight-1.0.31-py2.py3-none-any.whl.zip
- 图上的交互式回归:通过手动选择回归区域对图中的绘制数据执行回归。-matlab开发
- ranvid:视频租赁店
- .NET网上鲜花销售系统的ASP毕业设计(源代码+论文).zip
- 转移学习
- MyWorks:这是我工作的地方
- fastformer:fastformer模型,数据和培训代码
- ShiroExploit-Deprecated:Shiro550Shiro721一键化利用工具,支持多种回显方式
- 基于PHP的最新小储云商城V1.782免授权PHP源码.zip
- numeric-expression-parser:可以处理歧义的数字表达式的解析器。 它可以在前缀和后缀中转换中缀表示法,并可以评估结果
- 神经控制教程 - 灵活旋转关节的应用:西班牙语教程,关于神经控制。 仅用于学术和教育用途。-matlab开发
- VS2019插件:ClaudiaIDE+ColorThemeEditor.rar
- templates:模板和脚本
- aabbtree-2.7.0-py2.py3-none-any.whl.zip
- Blue_Dentures:终极蓝牙伴侣计划。一套用于蓝牙的数字假牙
- 无 RS 码的 ofdm 传输与数字调制技术的比较:这是 OFDM 传输,无需 RSCode。也通过数字调制技术(bpsk,-matlab开发
