使用Drupal构建地图式网站实战
"Mapping with Drupal - 由Alan Palazzolo和Thomas Turnbull编著,这本教程详细介绍了如何使用Drupal开发地图式网站功能。"
在 Drupal 平台上构建地图功能,可以帮助用户以直观、交互的方式呈现地理位置数据,这对于旅游、房地产、活动策划等领域的网站尤其有用。"Mapping with Drupal" 一书提供了深入的指导,教你如何充分利用 Drupal 的强大功能来创建这样的应用。
首先,书中的内容可能涵盖了 Drupal 中与地图集成的基础模块,如 Geofield 和 Geolocation,这些模块允许你添加和管理地理坐标数据。Geofield 允许用户输入经纬度或选择地图上的位置,而 Geolocation 可以自动检测用户的位置,为用户提供更个性化的体验。
其次,书中可能会详细介绍如何配置和自定义 OpenLayers 模块,这是一个用于在 Drupal 网站上展示地图的强大工具。OpenLayers 允许你使用多种地图服务,如 Google Maps、Bing Maps 或 OpenStreetMap,创建交互式地图,并添加图层、标记、信息窗口等元素。
此外,书中可能会涵盖地理围栏(geofencing)和基于位置的服务,这些功能可以依据用户的位置触发特定的行为,比如显示附近的兴趣点或发送定制的消息。对于需要跟踪移动设备位置的应用,这部分内容尤为重要。
数据的导入和导出也是关键部分,书中可能解释了如何处理 CSV 或 GPX 文件中的地理数据,以及如何将这些数据与 Drupal 内容类型关联,以便在地图上显示。
除此之外,你可能会学到如何利用 Views 模块来创建地图视图,这允许你根据特定的条件和过滤器动态显示地图内容。同时,书里可能还会讨论如何利用 Drupal 的钩子和API扩展地图功能,以及如何通过主题化控制地图的外观和感觉。
最后,安全性、性能优化和用户体验设计也是“Mapping with Drupal”中不可或缺的部分,书中的作者可能会提供最佳实践和技巧,确保你的地图功能既实用又安全。
“Mapping with Drupal”是一本面向 Drupal 开发者的实用指南,它将帮助你构建功能丰富的地图应用程序,提升网站的互动性和实用性。无论你是 Drupal 新手还是经验丰富的开发者,这本书都将是你探索地理信息在 Drupal 中应用的宝贵资源。

The Power of Maps
Maps, generally defined, probably first appeared over 18,000 years ago (see Wikipe-
dia), but it wasn’t really until the 1500s that maps (as we think of them today) were
produced in large numbers (Woods, Rethinking the Power of Maps, page 27). Around
that time, maps became significant navigational and military aids and powerful tools
for cities, states, and nations to help organize boundaries and administrative activities.
These maps started to outline and actually define states and other political boundaries.
Woods writes, “the map possessed an all but unique power to give the elusive idea of
the state concrete form, to those outside looking in, certainly, but also to those living
within.” This idea that maps have the power to literally define the world around us,
and not just represent it, still holds true today and is in your hands as a map maker.
It is important to keep in mind that while maps are driven by data that has been col-
lected, often from observed data, maps are not inherently objective artifacts. A common
perception of a map is that it is a neutral display of collected data, similar to a spread-
sheet. But there are many questions when looking at a spreadsheet or a map: How
accurate is the data? How was the data collected? What data is not presented? These
issues show the subjectivity of maps.
Maps are akin to statistics. This definition of statistics from Wikipedia could apply to
mapmaking: “Statistics is the study of the collection, organization, analysis, and inter-
pretation of data.” In statistics, data gets collected, aggregated, and then put through
various mathematical algorithms to either prove or disprove a hypothesis, usually
around some preexisting idea about the world. Statistics can easily be misused by ap-
plying specific methodologies to ensure a certain analytical outcome. In the same way,
a mapmaker collects and combines a huge amount of data, simplifies and codifies it,
and then presents it on paper or a computer screen so as to assert some specific idea.
Depending on the decisions made throughout the process, that idea can be conveyed
in many ways.
Maps are art. “Art is the product or process of deliberately arranging items (often with
symbolic significance) in a way that influences and affects one or more of the senses,
emotions, and intellect” (Wikipedia). Once data has been collected for a map, there
are still many decisions to be made on how to visually communicate that data on a
map, such as symbols, colors, interactions, or annotations. How does one symbolize a
church? What color is a county road? Where will the legend be? With maps, as with
art, every decision, no matter how small, is often intentional, so to convey a very specific
vision to the viewer. In these decisions is the power to communicate with maps.
Story Telling
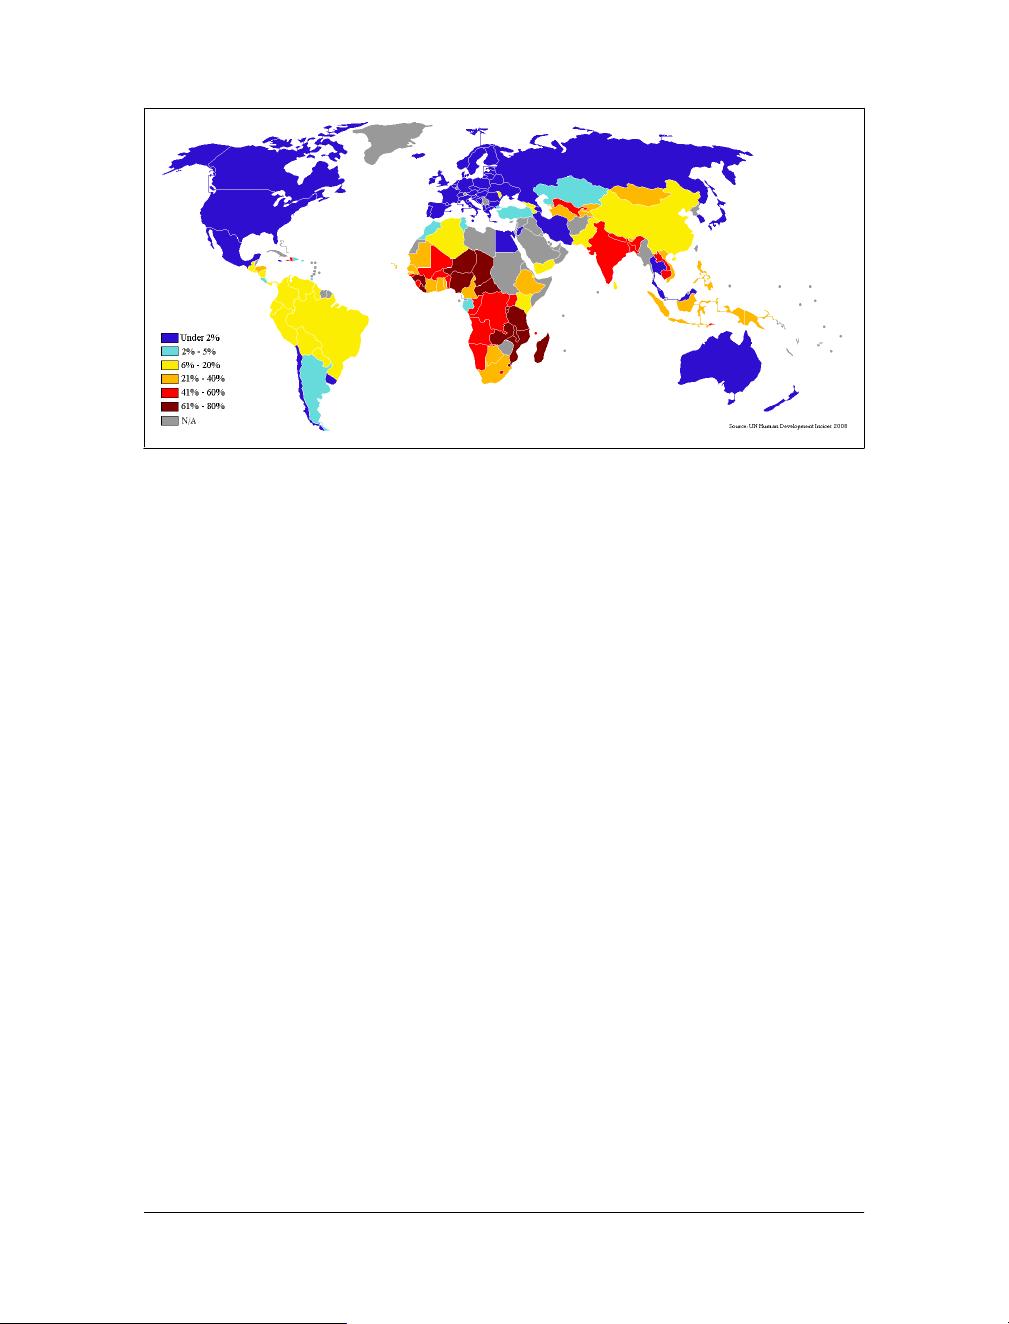
Maps tell a story. Users expect a map to communicate an idea to them. This could be
a story about how there are over a billion people that live on less than a dollar a day
(see Figure 1-1). Or the story could be more complex, describing the rise, climax, and
2 | Chapter 1: Why Map with Drupal

剩余147页未读,继续阅读
151 浏览量
122 浏览量
108 浏览量
117 浏览量
142 浏览量
2023-08-26 上传
269 浏览量

javking
- 粉丝: 6
 我的内容管理
展开
我的内容管理
展开


最新资源
- webacus工具实现自动页面生成与报表导出功能
- 深入理解FAT32文件系统及其数据存储与管理
- 玛纳斯·穆莱全栈Web开发学习与WakaTime统计
- mini翼虎播放器官方安装版:CG视频教程全能播放器
- CoCreate-pickr:轻便的JavaScript选择器组件指南与演示
- 掌握Xdebug 5.6:PHP代码调试与性能追踪
- NLW4节点项目:使用TypeORM和SQLite进行用户ID管理
- 深入了解Linux Bluetooth开源栈bluez源代码解析
- STM32与A7105射频芯片的点对点收发控制实现
- 微信高仿项目实践:FragmentUtil使用与分析
- 官方发布的CG视频教程播放器 mini翼虎x32v2015.7.31.0
- 使用python-lambder自动化AWS Lambda计划任务
- 掌握异步编程:深入学习JavaScript的Ajax和Fetch API
- LTC6803电池管理系统(BMS)经典程序解析
- 酷音传送v2.0.1.4:正版网络音乐平台,歌词同步功能
- Java面向对象编程练习:多态在游戏对战模拟中的应用
