多目标滤波性能评价的新一致性指标
需积分: 10 56 浏览量
更新于2024-09-05
收藏 843KB PDF 举报
本文档标题为《A Consistent Metric for Performance Evaluation of Multi-Object Filters》,着重于多目标滤波器性能评估领域的一项关键工作。在传统的多目标滤波理论中,尽管误差或遗漏距离(miss-distance)的概念在控制和滤波问题中扮演着基础角色,但现有的评价指标并未提供一个令人满意的定义,特别是在多目标滤波的复杂环境中。
多目标系统的研究起源于20世纪70年代早期,主要由航空、雷达、声纳、导航以及空中交通管理等应用驱动。在这些应用中,精确的目标跟踪是至关重要的,然而,如何量化和比较多个目标跟踪的性能,尤其是在存在杂波干扰的情况下,是一个长期存在的挑战。当前的多目标性能评估指标存在一些不一致性和局限性,它们可能无法准确反映滤波器在处理复杂场景下的实际效能。
论文作者Dominic Schuhmacher、Ba-Tuong Vo和Ba-Ngu Vo指出,衡量多目标滤波器的性能时,比如在误漏概率、目标状态估计精度、联合检测与跟踪的效率等方面,现有的评估方法可能无法提供一致和直观的理解。他们认识到,缺乏一个既数学上严谨又直观的指标体系,可能导致对滤波器性能的误解和优化方向的偏离。
为了克服这些问题,本文提出了一种新的多目标遗漏距离评估指标。这种新指标旨在解决现有方法的不足,通过引入 Wasserstein 距离(一种衡量随机集之间距离的统计学概念)或其他适当的数学工具,为多目标系统的性能评价提供了一个更为一致且实用的框架。论文详细阐述了新指标的数学原理,以及它如何改进了对多目标滤波器在真实应用场景中的表现的评估。
该文的工作对于改善多目标跟踪算法的设计、优化和比较具有重要意义,尤其是在现代信息技术如物联网和智能监控中,对多目标动态环境下的高效跟踪性能有很高的实际价值。因此,研究者和工程师们可以借助这篇论文中的理论和方法,提升多目标滤波器的性能评估标准,从而推动相关技术的发展。
SCHUHMACHER et al.: A CONSISTENT METRIC FOR PERFORMANCE EVALUATION OF MULTI-OBJECT FILTERS 3449
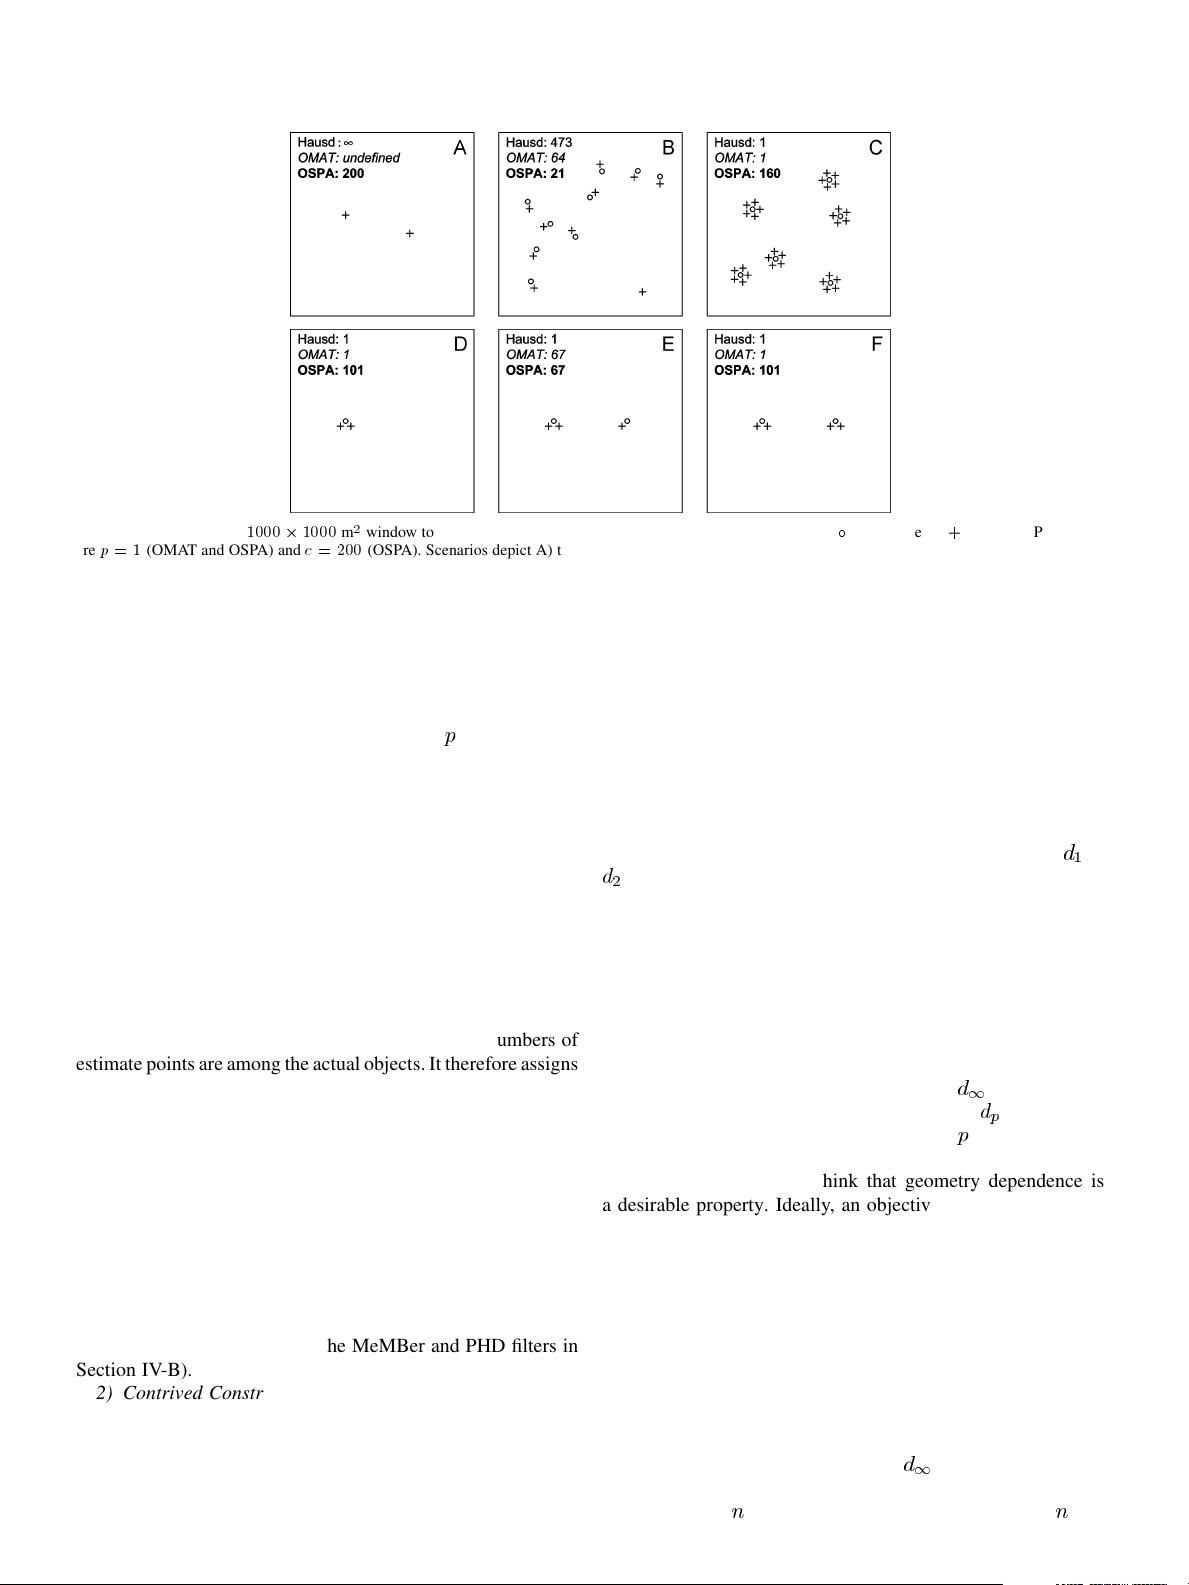
Fig. 2. Six scenarios in a
1000
2
1000
m
window to illustrate the strengths and weaknesses of the various metrics.
actual objects,
+
estimates. Parameters
are
p
=1
(OMAT and OSPA) and
c
= 200
(OSPA). Scenarios depict A) two false estimates; B) an outlier false estimate among several accurate estimates; C)
multiple estimates per object; D–F) a comparison of balanced and unbalanced allocations of estimates to objects. Note that Scenarios B
–F are an artistic impression
rather than an exact rendering of the situation in the sense that the smallest distances have been considerably in
flated for better viewing (from 1 meter, which was
assumed in the computations, to 40 meters in the scale of the pictures).
The merits of the OMAT metric are that it partly fixes the
undesirable cardinality behaviour of the Hausdorff metric (see
Scenario E of Fig. 2) and that it can cope with the outlier
problem by the introduction of the parameter
(Scenario B of
Fig. 2). Regarding this second point, it should be mentioned
that there are also generalizations of the Hausdorff metric that
avoid this problem [16].
On the downside, the OMAT metric entails a host of prob-
lems; the most important of these are outlined as follows:
1) Inconsistency of the Metric: Consider Scenarios D–Fin
Fig. 2. Each of these examples involves a cardinality error, and
from an intuitive point of view we would say that the estimation
errors are roughly equal, but that E is probably a bit better than
F and (arguably) somewhat better than D. While the Hausdorff
distance is the same in all three examples (undesirably small due
to the cardinality problem, but at least consistent), the OMAT
metric actually depends on how well balanced the numbers of
estimate points are among the actual objects. It therefore assigns
a much larger distance in Scenario E than in the other two cases,
and thus ranks the scenario that we intuitively prefer (E) as by
far the worst among the three.
This series of examples further reveals that the OMAT metric
is not always better than the Hausdorff metric at detecting
different cardinalities. This becomes even more obvious in
Scenario C of Fig. 2, where the cardinality of the estimated
point pattern is quite far from the truth. However, since the
estimates are perfectly balanced among the ground truth ob-
jects, the OMAT metric does not detect this. While the scenario
depicted is certainly an extreme one, it is in essence not unre-
alistic (see our comparison of the MeMBer and PHD filters in
Section IV-B).
2) Contrived Construction for Differing Cardinalities: De-
composing individual objects into small parts does not seem
very attractive from an intuitive point of view and often makes
the resulting distances hard to interpret. While visual perception
sometimes tells us that a reasonable matching of estimated ob-
jects to ground truths would involve splitting up of unit masses
(e.g., Scenario E in Fig. 2, where we would naturally match the
two estimates on the left with the one ground truth object next to
them), the OMAT metric does not cater for such natural structure
(and it is in fact hard for any metric to do so). Instead, it tends to
assign partial masses between the two sets of objects in a com-
plicated way, which may be difficult to comprehend for a human
observer. For example the Hausdorff distance in Scenario B is
clearly the distance from the isolated filter estimate to its closest
ground truth object, whereas the optimal mass transfer for
or
is not so obvious.
3) Geometry Dependent Behaviour: In [14], Hoffman and
Mahler describe what they call the geometry dependence of the
OMAT metric, stating that a multi-object filter should be more
heavily penalized for misestimating cardinality when the objects
are far apart than when they are closely spaced. The rationale be-
hind this statement is that it is harder to estimate the number of
objects when they are closely spaced. Under the assumption that
a multi-object filter consistently misestimates the number of ob-
jects, the authors argue that the magnitude of
approximately
equals the diameter of the ground truth (and that
shows a sim-
ilar dependence on the diameter for smaller
albeit to a lesser
degree).
In contrast, we do not think that geometry dependence is
a desirable property. Ideally, an objective performance metric
should depend on as few specific features of the considered
test case as possible in order to allow direct comparisons be-
tween different scenarios (or different stages within the same
scenario). The need for reinterpretation of the OMAT distances
according to the geometry of the ground truth as described in
[14] means that we have to transform these distances in order to
arrive at error quantities that are comparable with one another.
Such quantities, however, do not in general satisfy the metric
axioms any more and other desirable properties of the OMAT
metric might be lost as well.
Moreover, the stated dependence of
on the diameter of the
ground truth is a strong simplification. Consider for example a
ground truth of
objects that are arranged as a regular -gon
剩余10页未读,继续阅读
340 浏览量
2012-04-26 上传
2009-09-24 上传
154 浏览量
108 浏览量
2022-03-31 上传
339 浏览量
284 浏览量
699 浏览量

wangding1217
- 粉丝: 0
 我的内容管理
展开
我的内容管理
展开


最新资源
- A7Demo.appstudio:探索JavaScript应用开发
- 百度地图范围内的标注点技术实现
- Foobar2000绿色汉化版:全面提升音频播放体验
- Rhythm Core .NET库:字符串与集合扩展方法详解
- 深入了解Tomcat源码及其依赖包结构
- 物流节约里程法的文档整理与实践分享
- NUnit3.vsix:快速安装NUnit三件套到VS2017及以上版本
- JQuery核心函数使用速查手册详解
- 多种风格的Select下拉框美化插件及其js代码下载
- Mac用户必备:SmartSVN版本控制工具介绍
- ELTE IK Web编程与Web开发课程内容详解
- QuartusII环境下的Verilog锁相环实现
- 横版过关游戏完整VC源码及资源包
- MVC后台管理框架2021版:源码与代码生成器详解
- 宗成庆主讲的自然语言理解课程PPT解析
- Memcached与Tomcat会话共享与Kryo序列化配置指南
