Python图形绘制:饼图与条形图示例
DOC格式 | 1.13MB |
更新于2024-06-25
| 63 浏览量 | 举报
"该文档是关于Python图形绘制的源代码示例,主要涵盖了两种图表的绘制:饼图和条形图。饼图展示了如何利用matplotlib库创建带有百分比标签、阴影效果以及特定切片突出显示的图表。条形图则演示了如何绘制带有误差条的男女数据对比图,并设置了轴标签和图例。"
在Python编程中,matplotlib库是一个广泛使用的数据可视化工具,用于创建各种静态、动态和交互式的图表。这个文档提供了两个实例来展示matplotlib的使用方法:
1. 饼图(Pie Chart):
- `import matplotlib.pyplot as plt` 导入matplotlib的pyplot子模块,它是绘图的主要接口。
- `plt.subplots()` 创建一个Figure对象和一个Axes子对象,用于绘制图表。
- `ax1.pie()` 函数用于绘制饼图,参数包括各部分大小`sizes`、标签`labels`、爆炸效果`explode`、百分比标签格式`autopct`、阴影`shadow`和起始角度`startangle`。
- `ax1.axis('equal')` 使饼图保持等比例,确保绘制的是圆形。
- `plt.show()` 显示图表。
2. 条形图(Bar Chart):
- `import numpy as np` 导入numpy库,用于处理数值数组。
- `ax.bar()` 函数用于绘制条形图,参数包括x轴位置`index`、平均值`means`、条形宽度`bar_width`、透明度`opacity`、颜色`color`、误差条配置`error_kw`和标签`label`。
- `ax.set_xlabel()` 和 `ax.set_ylabel()` 分别设置x轴和y轴的标签。
- `ax.set_xticks()` 定义x轴的刻度标记。
- `ax.legend()` 添加图例。
这些源代码是学习和实践Python数据可视化的基础,通过它们你可以了解如何使用matplotlib来呈现不同类型的统计图表,从而更好地理解数据和进行数据展示。在实际项目中,可以根据需要调整这些参数和数据,以适应不同的数据分析需求。
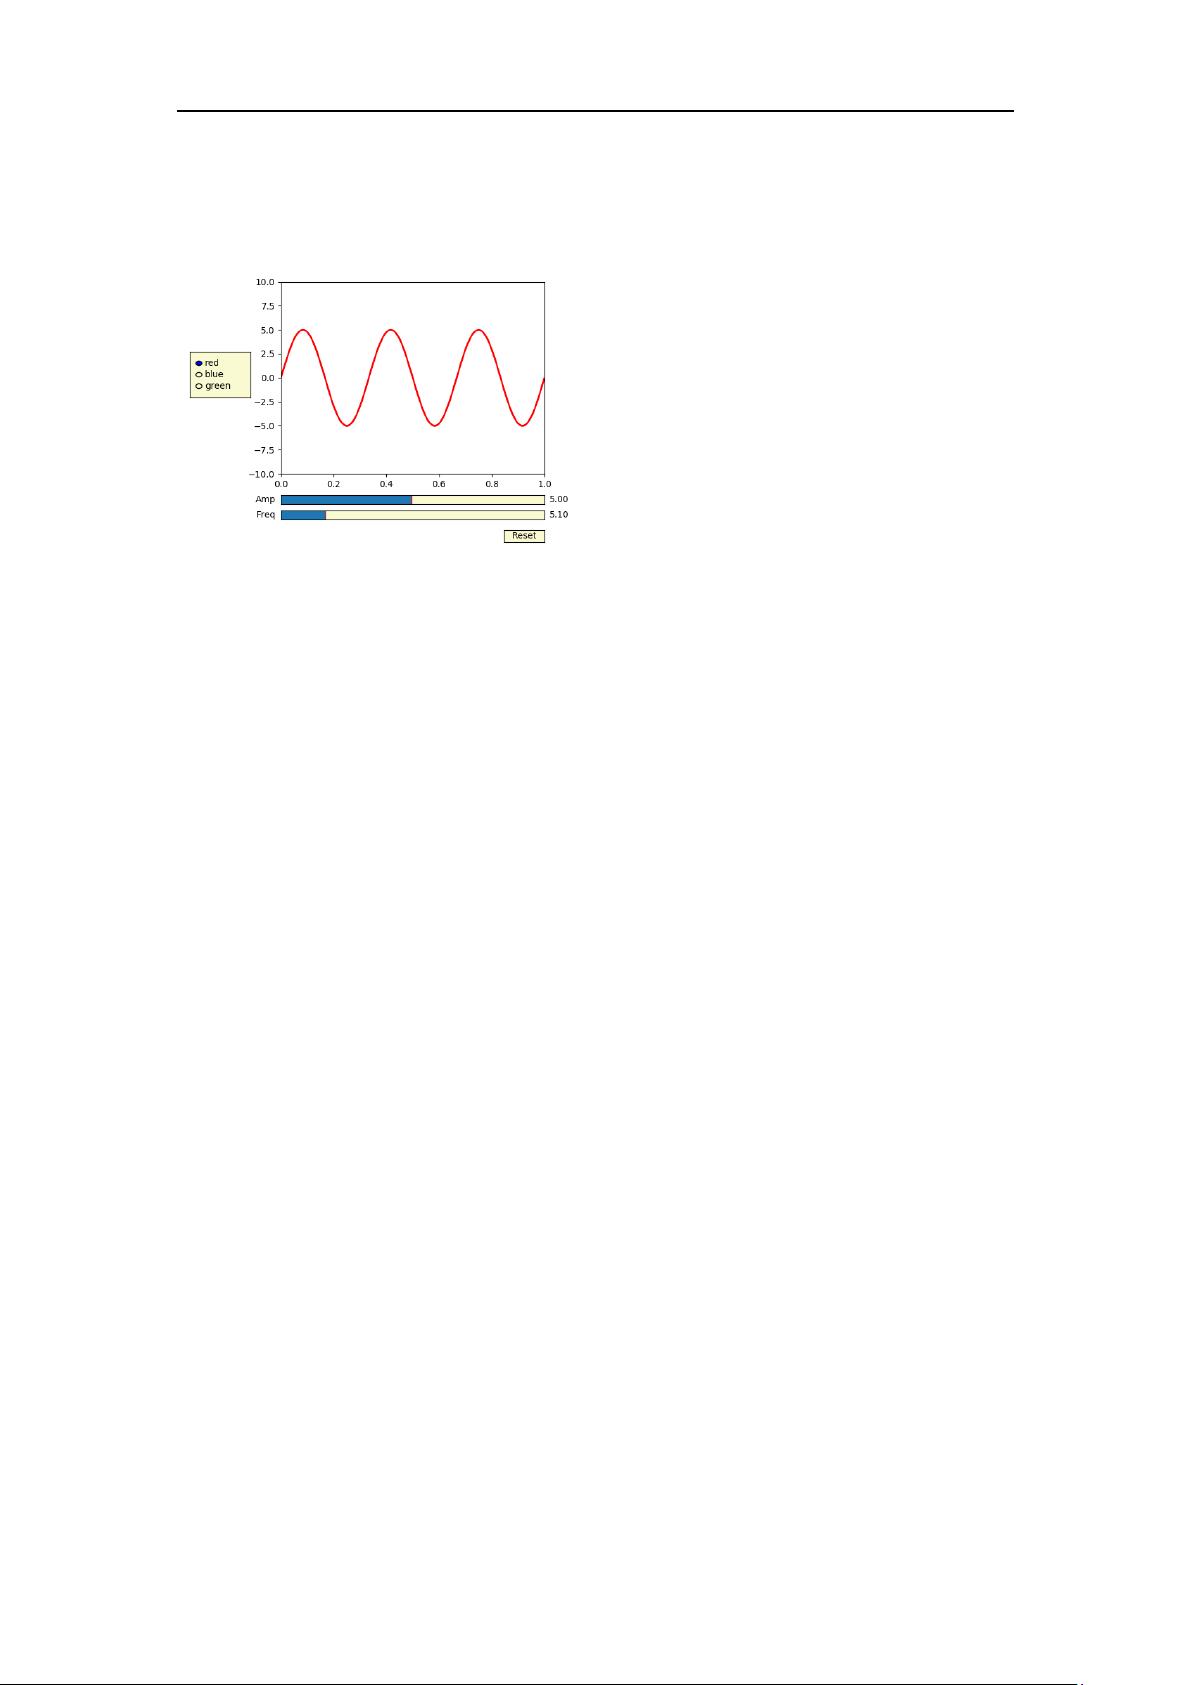
python 图形绘制源代码
radio.on_clicked(colorfunc)
plt.show()
数据打钩标签图
import datetime
import numpy as np
import matplotlib.pyplot as plt
import matplotlib.dates as mdates
import matplotlib.cbook as cbook
years = mdates.YearLocator() # every year
months = mdates.MonthLocator() # every month
yearsFmt = mdates.DateFormatter('%Y')
# Load a numpy record array from yahoo csv data with fields date, open, close,
# volume, adj_close from the mpl-data/example directory. The record array
# stores the date as an np.datetime64 with a day unit ('D') in the date column.
with cbook.get_sample_data('goog.npz') as datafile:
r = np.load(datafile)['price_data'].view(np.recarray)
fig, ax = plt.subplots()
ax.plot(r.date, r.adj_close)
# format the ticks
ax.xaxis.set_major_locator(years)
ax.xaxis.set_major_formatter(yearsFmt)
ax.xaxis.set_minor_locator(months)
# round to nearest years...
datemin = np.datetime64(r.date[0], 'Y')
datemax = np.datetime64(r.date[-1], 'Y') + np.timedelta64(1, 'Y')
ax.set_xlim(datemin, datemax)
剩余26页未读,继续阅读
相关推荐


小虾仁芜湖
- 粉丝: 115
 我的内容管理
展开
我的内容管理
展开


最新资源
- LineControl:轻量级HTML5文本编辑器JQuery插件
- FusionCharts导出功能核心组件介绍
- Vuforia AR教程:构建应用程序的入门指南
- 探索SwiftBySundell:代码示例与Swift学习资源
- 宠物定时喂食器设计原理与应用解析
- 提升PDF处理效率的工具推荐
- ASP.NET在线投票系统实现与数据库使用教程
- 利用回溯算法深入解决组合问题
- easyUI datagrid工程项目实战:增删查改与布局管理
- Qt官方文档汉化版:中文帮助文档完整翻译
- 物业公司专属蓝色风格网站模板设计教程
- 一键配置Hbase的压缩文件包下载
- ZeroBranePackage:ZeroBrane Studio集成的开源软件包
- CSerialPort类在VS2008中的应用及ComTool工具
- 个性化dotfiles配置及其自动化部署工具
- 成功试验USB转串口驱动,助力屏幕电脑应用
