


数据流中基于距离的异常检测方法研究
需积分: 9 17 浏览量
更新于2024-09-10
收藏 2.05MB PDF 举报
"Distance-based Outlier Detection in Data Streams"
在数据流中的距离基异常检测是当前数据分析领域中的一个重要课题,尤其在欺诈检测、网络安全和公共卫生等应用中具有显著价值。随着数据以流式的方式不断到达和消失,这为异常检测算法带来了时间效率和空间效率上的新挑战。过去十年间,许多研究致力于解决数据流中的距离基异常检测问题(DODDS),这种方法采用无监督的定义,不对数据值有任何分布假设。
这篇论文由Luan Tran、Liyue Fan和Cyrus Shahabi合作完成,他们都是南加州大学计算机科学系和集成媒体系统中心的研究人员。论文指出,尽管已有一些最先进的算法被提出用于DODDS,但缺乏在相同数据集和平台上对这些算法的比较性评估。因此,他们的工作旨在系统地评估多种最新的DODDS算法,在不同的流设置和异常率条件下进行对比分析。
论文的主体部分可能包含了以下内容:
1. 异常检测基础理论:首先,作者可能会回顾异常检测的基本概念,包括距离度量方法(如欧氏距离、曼哈顿距离等)和如何利用这些度量来识别与正常模式偏离的数据点。
2. 算法对比:接着,他们会详细介绍所选取的几种代表性距离基异常检测算法,如LOF(局部离群因子)、KNN(K最近邻)、DBSCAN(密度基空间聚类)等,以及这些算法的优缺点。
3. 实验设计:这部分可能描述了实验环境的设置,包括数据生成策略(如模拟真实数据流的特性)、不同异常率的设定,以及性能指标(如检测精度、误报率、计算复杂度等)。
4. 结果分析:论文将展示实验结果,通过比较不同算法在不同条件下的表现,给出哪种算法在特定环境下更有效,或者在时间和空间效率上更有优势。
5. 讨论与结论:最后,作者可能会讨论他们的发现,指出当前算法的局限性和未来研究的方向,例如如何优化算法以适应高速数据流,提高实时性,同时降低计算资源的需求。
这篇论文对于理解数据流中异常检测的现状和挑战,以及选择适合特定应用场景的算法具有很高的参考价值。通过系统的比较,它提供了对现有技术的深入见解,并可能激发进一步的算法改进和创新。
A naive solution is to store the neighbors of every data
point and recompute the neighbors when the window slides,
which ca n be computationally expensive. Another approach
is to use incremental algorithms: each data poi nt stores its
neighbors that can prove itself an inlier o r outlier. When the
window slides, the neighbor information of those data points
which have at least o n e expired neighbor will be updated.
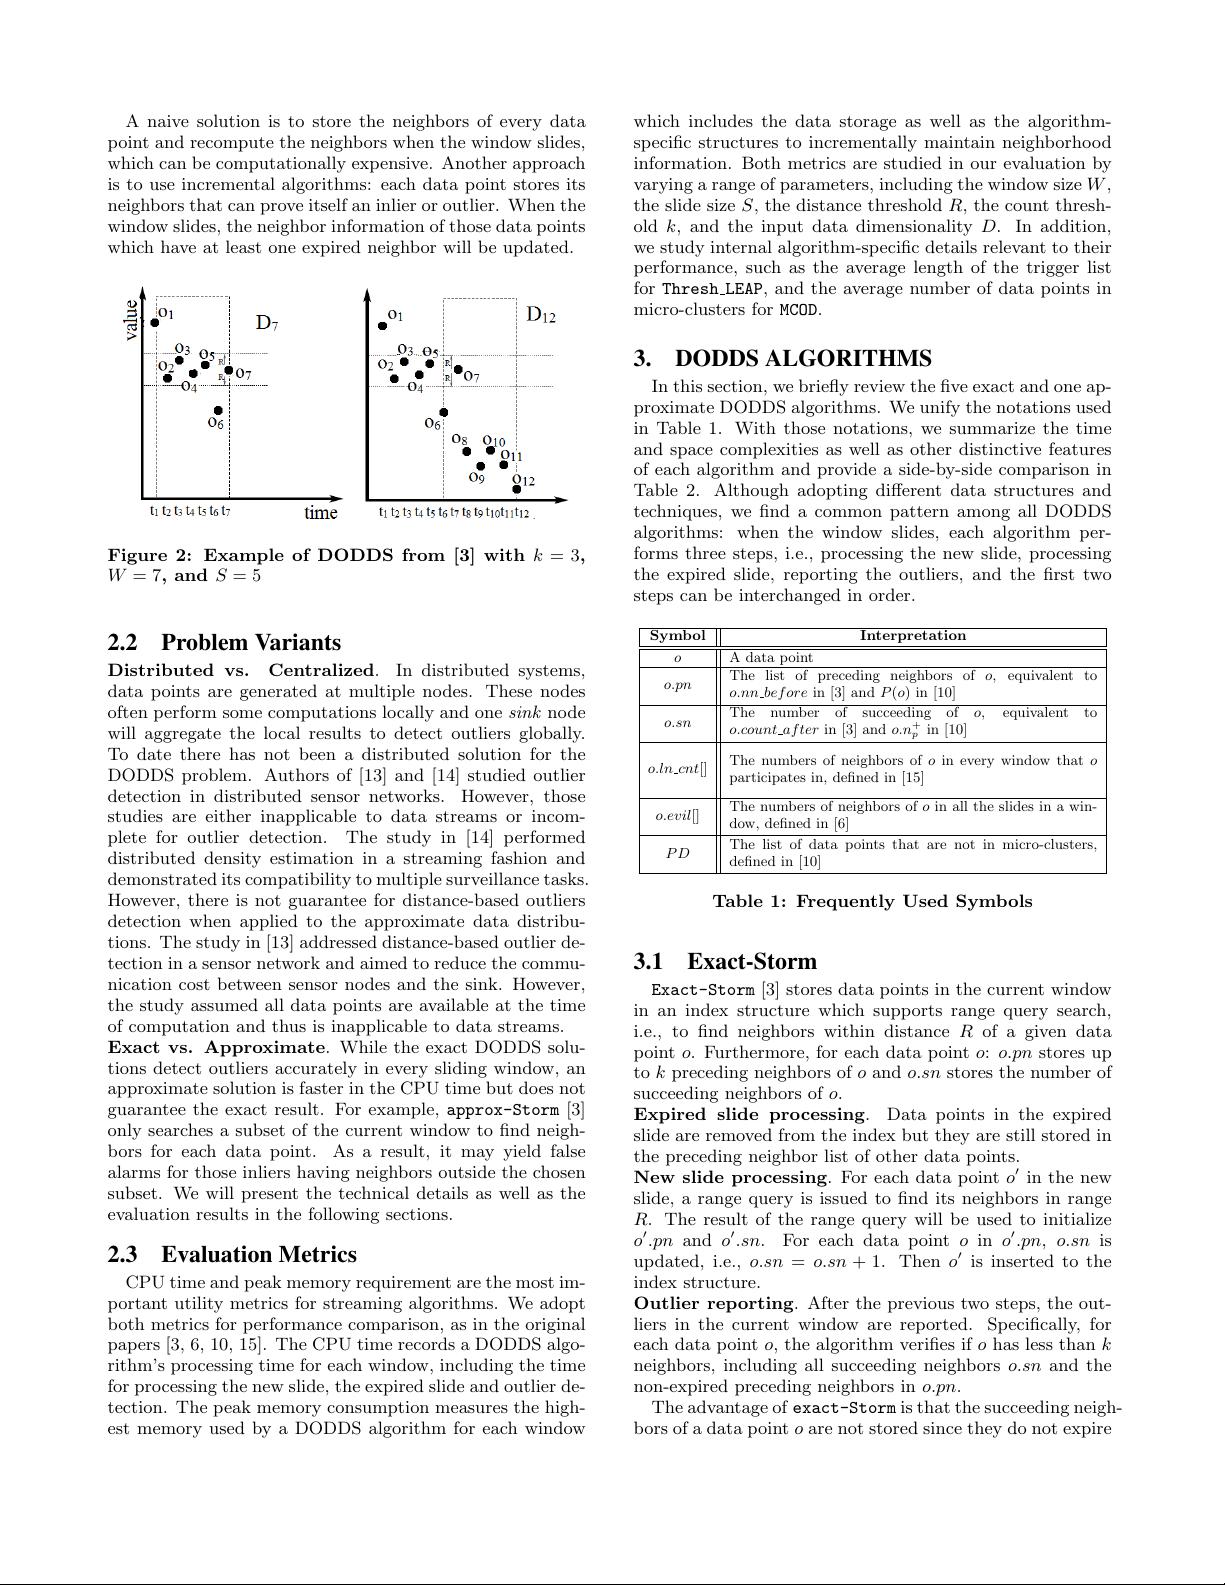
Figure 2: Example of DODDS from [3] with k = 3,
W = 7, and S = 5
2.2 Problem Variants
Distributed vs. Centralized. In distributed systems,
data points are generated at multiple nodes. These nodes
often perform some computations locally and one sink node
will ag g rega t e the local results to detect outliers g l ob a l ly.
To date there has not been a distributed solution for the
DODDS problem. Authors of [13] and [14] studied outlier
detection in distributed sensor networks. However, those
studies are either inapplicable to da t a streams or incom-
plete for ou t l ier detection. The study i n [14] performed
distributed density estimation in a streaming fashion and
demonstrated its compatibility to multiple surveillance tasks.
However, there is not guarantee for distance-based outliers
detection when applied to the approximate data d ist ri b u -
tions. The study in [1 3 ] addressed distance-based outlier de-
tection in a sen so r network and aimed to reduce the commu-
nication cost between sensor nodes and the sink. However,
the study assumed all data points are available at the time
of computation and thus is ina p p l ica b l e to data streams.
Exact vs. Approximate. While the exact DODDS solu-
tions det ec t outliers accurately in every sliding window, an
approximate solution is faster in the CPU time but does not
guarantee the exact result. For example, approx-Storm [3]
only searches a subset of the current window to find neigh-
bors for each data point. As a result, it may yield false
alarms for tho se inliers having neighbors outsid e the chosen
subset. We will present the technical details as well as the
evaluation results in th e following sect i o n s.
2.3 Evaluation Metrics
CPU time and peak memory requirement are the most im-
p
ortant utility metrics for streaming algorithms. We adopt
both metrics for performance comparison, as in the original
papers [3, 6, 10, 15]. The CPU time records a DODDS alg o -
rithm’s processing time for each window, including the time
for processing the new slide, the expired slide and outlier de-
tection. The peak memory consumption measures the high-
est memory used by a DODDS alg o rith m for each window
which includes the data st o ra g e as well as the algorithm-
specific struct u res to incrementally maintain neighborhood
information. Both metrics are studied in our evaluation by
varying a range of parameters, including the window size W ,
the slide size S, the distance threshold R, the count thresh-
old k, and the input data dimensionality D. In addition,
we study internal algorithm-specific details relevant to their
performance, such a s the average length of the trigger list
for Thresh
LEAP, and the average number of data points in
micro-clusters for MCOD.
3. DODDS ALGORITHMS
In this section, we briefly review the five exact and one ap-
proximate DODDS algorithms. We unify the notations used
in Table 1. With those notations, we summarize the time
and space complexities as well as other distinctive features
of each algorithm and provide a side-by-side comparison in
Table 2. Although adopting different data structures and
techniques, we find a common pattern among all DODDS
algorithms: when the window slides, each algorithm per-
forms three steps, i.e., p rocessing the new sli d e, processing
the expired slide, reporting the outliers, and the first two
steps can be interchanged in order.
Symbol Interpretation
o A data point
o.pn
The list of preceding neighbors of o, equivalent to
o.nn bef ore in [3] and P(o) in [10]
o.sn
The number of succeeding of o, equivalent to
o.count af ter in [3] and o.n
+
p
in [10]
o.ln cnt[]
The numbers of neighbors of o in every window that o
participates in, defined in [15]
o.evil[]
The numbers of neighbors of o in all the slides in a win -
dow, d efi n ed in [6]
P D
The list of data points that are not in micro-clusters,
defined in [10]
Table 1: Frequently Used Symbols
3.1 Exact-Storm
Exact-Storm [
3] stores data points in the cu rrent window
in an index structure which supports range query search,
i.e., to find neighbors within distance R of a given data
point o. Furtherm o re, for each data point o: o.pn stores up
to k preceding neighbors of o a n d o.sn stores the number of
succeeding neighbors of o.
Expired slide processing. Data points in the expired
slide are removed from the index but they are still stored in
the preceding neighbor list of other d a t a points.
New slide processing. For each data point o
′
in the new
s
lide, a range query is issued to find its nei ghbors in range
R. The result of the range query will b e used to initialize
o
′
.pn a
nd o
′
.sn. For each data point o in o
′
.pn, o.sn is
updated, i.e., o.sn = o.sn + 1. Then o
′
is inserted to the
index structure.
Outlier reporting. After the previous two steps, the out-
liers in the current window are reported. Specifically, for
each data point o, the algorithm verifies if o has less than k
neighbors, including all succeeding neighbors o.sn and the
non-expired preceding neighbors in o .p n .
The advantage of exact-Storm is tha t t h e suc c eed in g n eigh -
bors of a data point o are not stored since they do not expire
1091
下载后可阅读完整内容,剩余11页未读,立即下载
2023-11-17 上传
151 浏览量
155 浏览量
2023-11-17 上传
121 浏览量
158 浏览量
115 浏览量
168 浏览量
2021-03-06 上传

shoushudao111
- 粉丝: 59
 我的内容管理
展开
我的内容管理
展开


最新资源
- Java练习题答案解析指南
- OMNETSPMA协议仿真:多优先级QOS在网络传输中的应用
- 实验室管理系统:全功能介绍与操作指南
- json-lib基础教程:源码和工具包解读
- C#第二周教程:ToDoLIst-2项目实践
- 揭秘物理MAC地址修改工具的使用技巧
- 如何捕获屏幕并保存为文件:桌面与区域截图指南
- Java实现高效C/S架构数据库连接池技术
- YOLOv3与YOLOv4实现的口罩检测器技术细节
- 掌握LINQ技术:Visual C# 2005深入教程
- 设计与实现多功能数字钟与遥控装置
- 深入掌握嵌入式Linux驱动开发
- 仿通讯录功能 实现快速查找联系人
- Axis2 Eclipse插件使用详解
- ASP.NET在线答疑系统:计算机实验课程新平台
- GitHub课堂:直角三角形判断程序实战


