
IEEE
Transactions
on
Power
Apparatus
and
Systems,
Vol.
PAS-98,
No.6
Nov./Dec.
1979
IEEE
RELIABILITY
TEST
SYSTEM
A
report
prepared
by
the
Reliability
Test
System
Task
Force
of
the
Application
of
Probability
Methods
Subcommittee*
ABSTRACT
This
report
describes
a
load
model,
generation
system,
and
transmission
network
which
can
be
used
to
test
or
compare
methods
for
reliability
analysis
of
power
systems.
The
objective
is
to
define
a
system
sufficiently
broad
to
provide
a
basis
for
reporting
on
analysis
methods
for
combined
generation/transmission
(composite)
reliability.
The
load
model
gives
hourly
loads
for
one
year
on
a
per
unit
basis,
expressed
in
chronological
fashion
so
that
daily,
weekly,
and
seasonal patterns
can
be
modeled.
The
generating
system
contains
32
units,
ranging
from
12
to
400
MW.
Data
is
given
on
both
reliability
and
operating
costs
of
generating
units.
The
transmission
system
contains
24
load/generation
buses
connected
by
38
lines
or
autotransformers
at
two
voltages,
138
and
230
kV.
The
transmission
system
includes
cables,
lines
on
a
common
right
of
way,
and
lines
on
a
common
tower.
Transmission
system
data
includes
line
length,
impedance,
ratings,
and
relia-
bility
data.
INTRODUCTION
There
has
been
a
continuing
and
increasing
inter-
est
in
methods
for
power
system
reliability
evalua-
tion.
In
order
to
provide
a
basis
for
comparison
of
results
obtained
from
different
methods,
it
is
desir-
able
to
have
a
reference
or
"test"
system
which
incor-
porates
the
basic
data
needed
in
reliability
evalua-
tion.
The
purpose
of
this
report
is
to
provide
such
a
"reliability
test
system".
The
report
describes
a
load
model,
generation
system,
and
transmission
network.
The
objective
is
to
define
a
system
sufficiently
broad
to
provide
a
basis
for
reporting
on
analysis
methods
for
combined
gener-
ation/transmission
(composite)
reliability
methods.
It
is
not
practical
to
specify
all
the
parameters
needed
for
every
application.
The
goal
is
to
estab-
lish
a
core
system
which
can
be
supplemented
by
indi-
vidual
authors
with
additional
or
modified
parameters
needed
in
a
particular
application.
For
example,
the
reliability
test
system
as
reported
in
this
paper
does
not
include
data
on
the
following:
-
Substation
configuration
at
load/generation
buses
*
Chairman,
P.F.
Albrecht,
General
Electric;
M.P.
Bhavaraju,
Electric
Power
Research
Institute;
B.E.
Biggerstaff,
Federal
Energy
Regulatory
Commission;
R.
Billinton,
University
of
Saskatchewan;
G.
Elsoe
Jorgensen,
Northeast
Utilities
Service
Company;
N.D.
Reppen,
Power
Technologies,
Inc.;
P.B.
Shortley,
New
England
Power
Planning.
F
79
152-0
A
paper
recommended
and
approved
by
the
IEEE
Power
System
Engineering
Committee
of
the
IEEE
Power
Engineering
Society
for
presentation
at
the
IEEE
PES
Winter
Meeting,
New
York,
NY,
February
4-9,
1979.
Manuscript
submitted
September
14,
1978;
made
available
for
printing
December
14,
1978.
-
Distribution
system
configuration
Interconnections
with
other
systems
-
Protective
relay
configurations
-
Future
expansion,
such
as
load
growth,
future
unit
sizes,
types,
and
reliability.
The
Electric
Power
Research
Institute
(EPRI)
has
recently
reported
data
on
synthetic
electric
utility
systems
[1].
These
contain
much
larger
systems
than
the
one
in
this
report.
They
are
designed
primarily
for
use
in
evaluation
of
alternate
technologies.
A
smaller
test
system
was
developed
by
the
CIGRE
Working
group
01
of
Study
Committee
No.
32
[2].
But
that
system
was
judged
too
small
and
incomplete
to
be
applicable
as
a
model
in
reliability
analysis,
espe-
cially
when
considering
composite
systems.
DESCRIPTION
OF
RELIABILITY
TEST
SYSTEM
Load
Model
The
annual
peak
load
for
the
test
system
is
2850
MW.
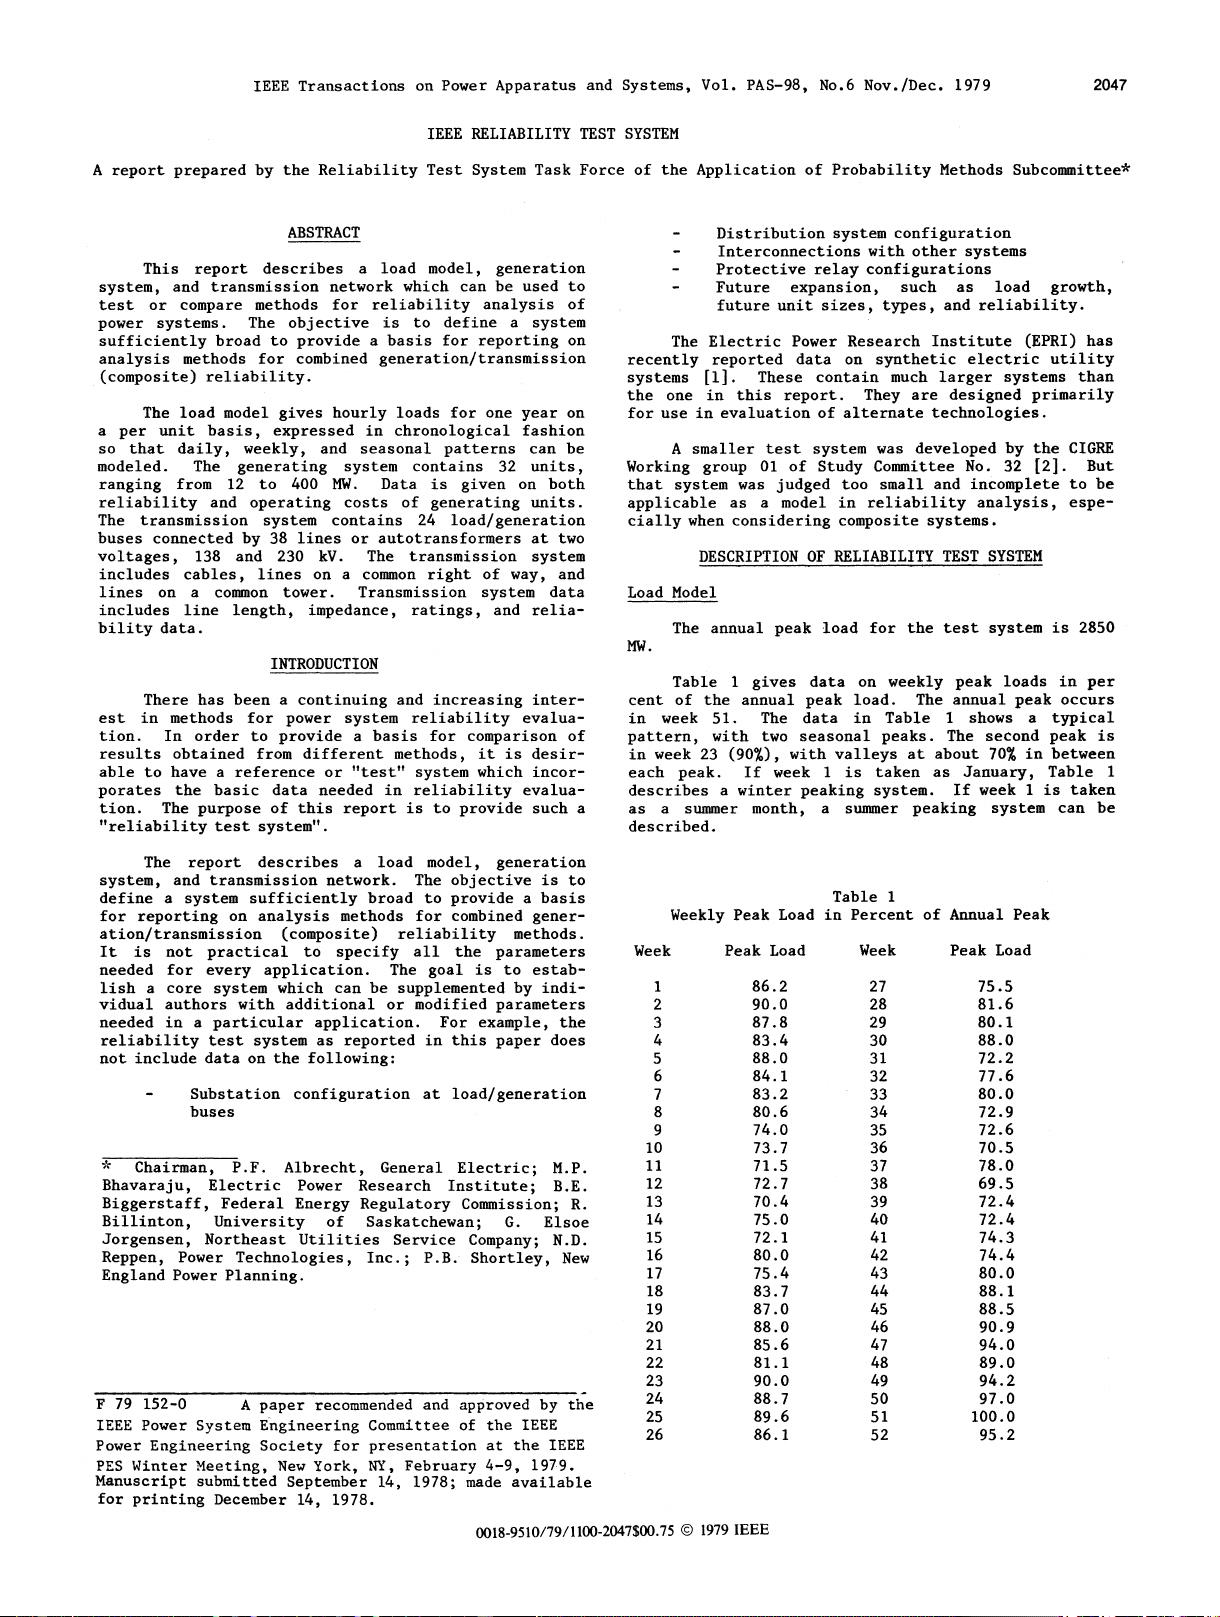
Table
1
gives
data
on
weekly
peak
loads
in
per
cent
of
the
annual
peak
load.
The
annual
peak
occurs
in
week
51.
The
data
in
Table
1
shows
a
typical
pattern,
with
two
seasonal
peaks.
The
second
peak
is
in
week
23
(90%),
with
valleys
at
about
70%
in
between
each
peak.
If
week
1
is
taken
as
January,
Table
1
describes
a
winter
peaking
system.
If
week
1
is
taken
as
a
summer
month,
a
summer
peaking
system
can
be
described.
Weekly
Peak
Load
Week
1
2
3
4
5
6
7
8
9
10
11
12
13
14
15
16
17
18
19
20
21
22
23
24
25
26
Table
1
in
Percent
of
Annual
Peak
Peak
Load
Week
Peak
Load
86.2
90.0
87.8
83.4
88.0
84.1
83.2
80.6
74.0
73.7
71.5
72.7
70.4
75.0
72.1
80.0
75.4
83.7
87.0
88.0
85.6
81.1
90.0
88.7
89.6
86.1
27
28
29
30
31
32
33
34
35
36
37
38
39
40
41
42
43
44
45
46
47
48
49
50
51
52
75.5
81.6
80.1
88.0
72.2
77.6
80.0
72.9
72.6
70.5
78.0
69.5
72.4
72.4
74.3
74.4
80.0
88.1
88.5
90.9
94.0
89.0
94.2
97.0
100.0
95.2
0018-9510/79/1100-2047$00.75
©
1979
IEEE
2047
Authorized licensed use limited to: Fuzhou University. Downloaded on September 24,2020 at 09:55:54 UTC from IEEE Xplore. Restrictions apply.

qq_42747476
- 粉丝: 0
- 资源: 9
 我的内容管理
收起
我的内容管理
收起
- 我的资源
快来上传第一个资源
 我的收益 登录查看自己的收益
 我的积分
登录查看自己的积分
我的积分
登录查看自己的积分
 我的C币
登录后查看C币余额
我的C币
登录后查看C币余额
 我的收藏
我的收藏  我的下载
我的下载  下载帮助
下载帮助

会员权益专享


最新资源
- 27页智慧街道信息化建设综合解决方案.pptx
- 计算机二级Ms-Office选择题汇总.doc
- 单链表的插入和删除实验报告 (2).docx
- 单链表的插入和删除实验报告.pdf
- 物联网智能终端项目设备管理方案.pdf
- 如何打造品牌的模式.doc
- 样式控制与页面布局.pdf
- 武汉理工Java实验报告(二).docx
- 2021线上新品消费趋势报告.pdf
- 第3章 Matlab中的矩阵及其运算.docx
- 基于Web的人力资源管理系统的必要性和可行性.doc
- 基于一阶倒立摆的matlab仿真实验.doc
- 速运公司物流管理模式研究教材
- 大数据与管理.pptx
- 单片机课程设计之步进电机.doc
- 大数据与数据挖掘.pptx
资源上传下载、课程学习等过程中有任何疑问或建议,欢迎提出宝贵意见哦~我们会及时处理!
点击此处反馈


评论0