matplotlib在在python上绘制上绘制3D散点图实例详解散点图实例详解
主要介绍了matplotlib在python上绘制3D散点图实例详解,首先介绍了官网的实例,然后分享了本文简单代码示
例,具有一定借鉴价值,需要的朋友可以了解下。
大家可以先参考官方演示文档:
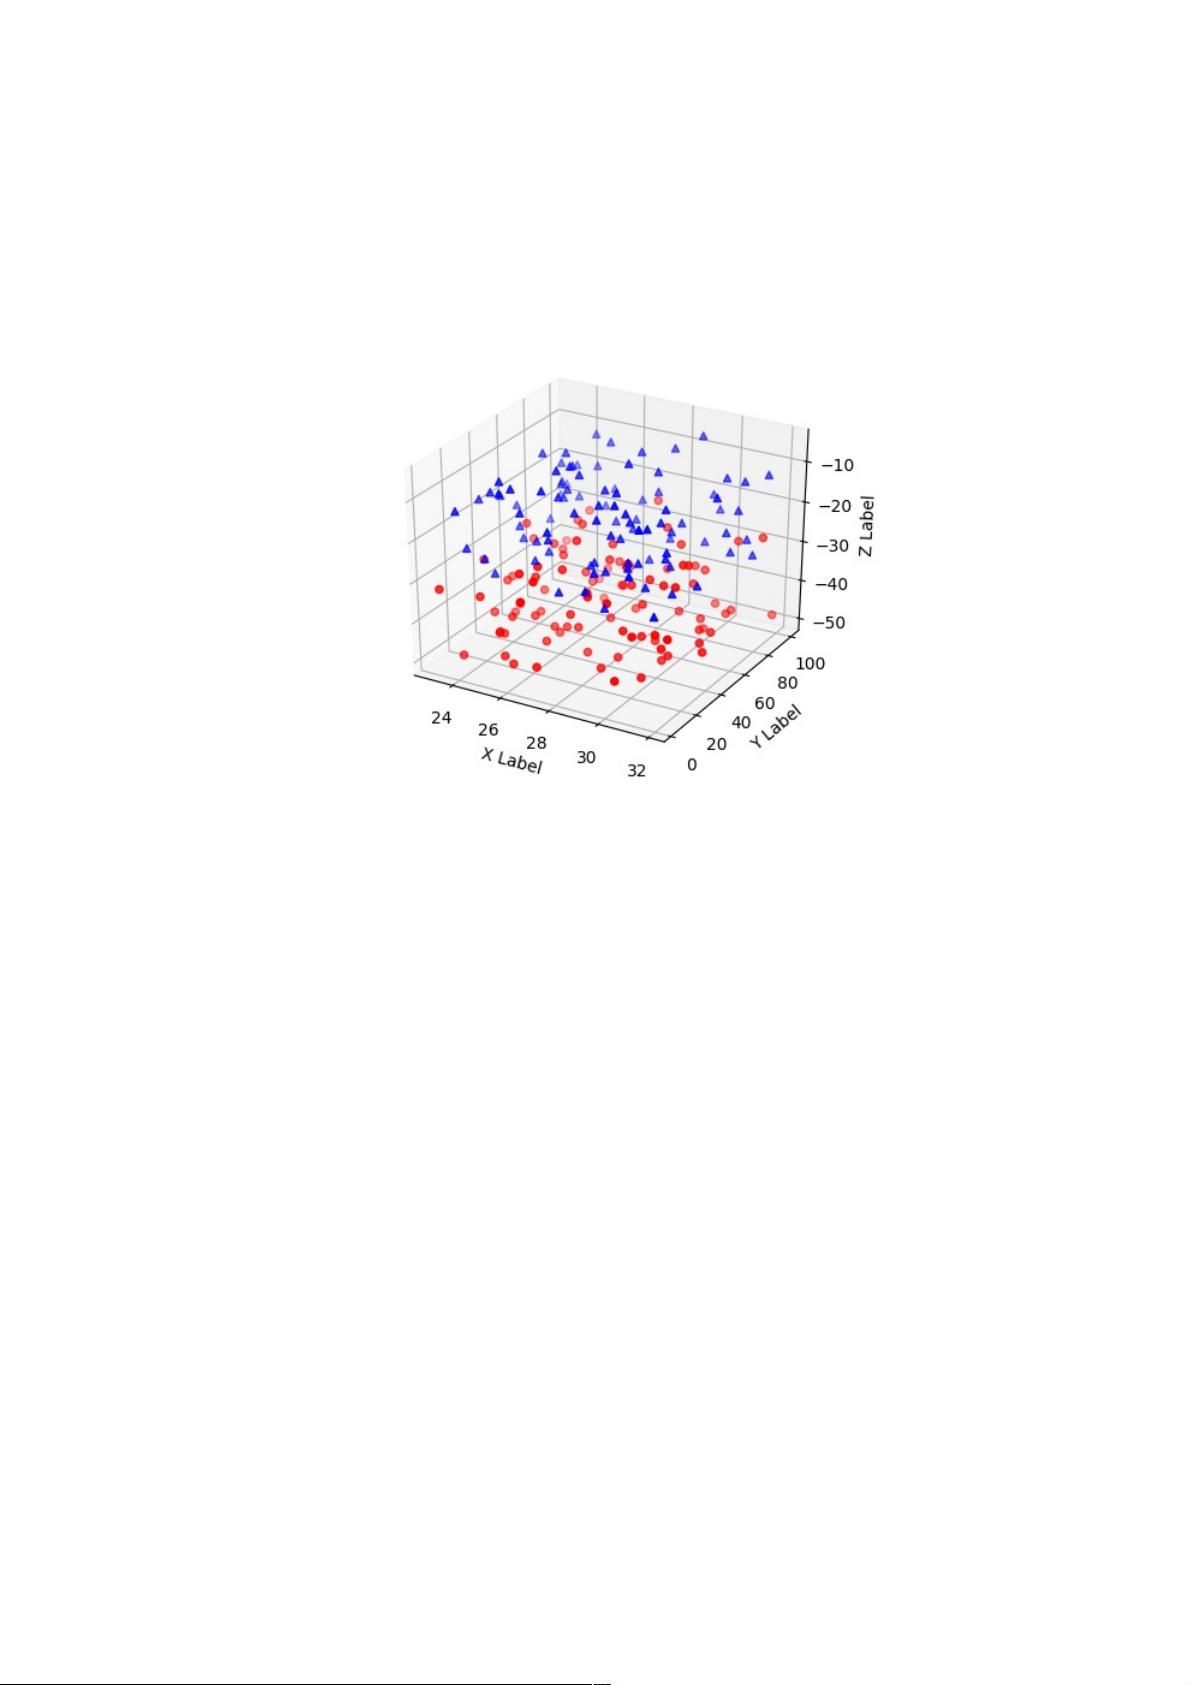
效果图:
'''
==============
3D scatterplot
==============
Demonstration of a basic scatterplot in 3D.
'''
from mpl_toolkits.mplot3d import Axes3D
import matplotlib.pyplot as plt
import numpy as np
def randrange(n, vmin, vmax):
'''
Helper function to make an array of random numbers having shape (n, )
with each number distributed Uniform(vmin, vmax).
'''
return (vmax - vmin)*np.random.rand(n) + vmin
fig = plt.figure()
ax = fig.add_subplot(111, projection='3d')
n = 100
# For each set of style and range settings, plot n random points in the box
# defined by x in [23, 32], y in [0, 100], z in [zlow, zhigh].
for c, m, zlow, zhigh in [('r', 'o', -50, -25), ('b', '^', -30, -5)]:
xs = randrange(n, 23, 32)
ys = randrange(n, 0, 100)
zs = randrange(n, zlow, zhigh)
ax.scatter(xs, ys, zs, c=c, marker=m)
ax.set_xlabel('X Label')
ax.set_ylabel('Y Label')
ax.set_zlabel('Z Label')
plt.show()
以上是官网上的代码示例及演示结果,下面分享下本文代码示例。
本实例需要导入第三包:

weixin_38593738
- 粉丝: 0
- 资源: 925
 我的内容管理
收起
我的内容管理
收起
- 我的资源
快来上传第一个资源
 我的收益 登录查看自己的收益
 我的积分
登录查看自己的积分
我的积分
登录查看自己的积分
 我的C币
登录后查看C币余额
我的C币
登录后查看C币余额
 我的收藏
我的收藏  我的下载
我的下载  下载帮助
下载帮助

会员权益专享


最新资源
- RTL8188FU-Linux-v5.7.4.2-36687.20200602.tar(20765).gz
- c++校园超市商品信息管理系统课程设计说明书(含源代码) (2).pdf
- 建筑供配电系统相关课件.pptx
- 企业管理规章制度及管理模式.doc
- vb打开摄像头.doc
- 云计算-可信计算中认证协议改进方案.pdf
- [详细完整版]单片机编程4.ppt
- c语言常用算法.pdf
- c++经典程序代码大全.pdf
- 单片机数字时钟资料.doc
- 11项目管理前沿1.0.pptx
- 基于ssm的“魅力”繁峙宣传网站的设计与实现论文.doc
- 智慧交通综合解决方案.pptx
- 建筑防潮设计-PowerPointPresentati.pptx
- SPC统计过程控制程序.pptx
- SPC统计方法基础知识.pptx
资源上传下载、课程学习等过程中有任何疑问或建议,欢迎提出宝贵意见哦~我们会及时处理!
点击此处反馈


评论0