没有合适的资源?快使用搜索试试~ 我知道了~
首页矢量信号分析及矢量信号源原理
资源详情
资源评论
资源推荐
Keysight Technologies
Vector Signal Analysis Basics
Application Note
2
Try before you buy!
Download the 89600 VSA software and use it free for 14 days
to make measurements with your analysis hardware, or use our
recorded demo signals by selecting File> Recall> Recall Demo>
QPSK> on the software toolbar. Request your free trial license
today:
www.keysight.com/find/89600_trial
Table of Contents
Vector signal Analysis ...............................................3
VSA measurement advantages . . . . . . . . . . . . . . . . . . . . . . . . . . . . . . . . . . . . . . . . . . 4
VSA measurement concepts and theory of operation .......................6
Data windowing – leakage and resolution bandwidth ......................12
Fast Fourier transform (FFT) analysis ....................................14
Time-domain display ..................................................16
Summary ............................................................18
Vector Modulation Analysis .........................................19
Introduction .........................................................19
Vector modulation and digital modulation overview........................20
Digital RF communication system concepts ..............................25
VSA digital modulation analysis concepts and theory of operation...........28
Flexible custom or user-definable demodulation...........................29
Demodulation analysis ................................................33
Measurement concepts ...............................................34
Analog modulation analysis ............................................38
Summary ............................................................40
Additional Resources ...............................................41
3
Vector Signal Analysis
This application note serves as a primer on vector signal analysis which, going
forward, will be referred to as VSA. This section discusses VSA measurement
concepts and theory of operation; the second section discusses vector-
modulation analysis and, specifically, digital-modulation analysis.
Analog, swept-tuned spectrum analyzers use superheterodyne technology to
cover wide frequency ranges; from audio, through microwave, to millimeter
frequencies. Fast Fourier transform (FFT) analyzers use digital signal process-
ing (DSP) to provide high-resolution spectrum and network analysis. Today’s
wide-bandwidth, vector-modulated (also called complex or digitally modulated),
time-varying signals benefit greatly from the capabilities of FFT analysis and
other DSP techniques. VSA provides fast, high-resolution spectrum measure-
ments, demodulation, and advanced time-domain analysis. VSA is especially
useful for characterizing complex signals such as burst, transient, or modulated
signals used in communications, video, broadcast, radar, and software-defined
radio applications.
Figure 1 shows a simplified VSA block diagram. VSA implements a very different
measurement approach than traditional swept analysis; the analog IF section is
replaced by a digital IF section incorporating FFT and digital signal processing
algorithms. Traditional swept-tuned spectrum analysis is an analog system; VSA
is fundamentally a digital system that uses digital data and mathematical algo-
rithms to perform data analysis. VSA software accepts and analyzes digitized
data from many measurement front ends, allowing you to troubleshoot through-
out the system block diagram.
ADC
Time
Anti-alias
filter
Quadrature
detector,
digital filtering
FFT
IF
input
Local
oscilator
RF
input
Time domain
Frequency domain
Modulation domain
Code domain
t
f
I
Q
0 code 15
I
Q
Demod-
ulator
90 degs
tt
Analog data
Digitized data stream
Digital IF
and
DSP techniques
LO
Figure 1. The vector signal analysis process requires a digitized analog input signal and then uses
DSP technology process and provide data outputs; the FFT algorithm produces frequency domain
results, the demodulation algorithms produce modulation and code domain results.
4
A significant characteristic of VSA is that it can measure and manipulate com-
plex data, i.e. magnitude and phase information. In fact, it is called vector signal
analysis because it takes complex input data, performs complex data analy-
sis, and outputs complex data results that include both magnitude and phase
information. Vector modulation analysis performs the basic functionality of a
measurement receiver. You will learn about vector modulation and detection in
the next section, Vector Modulation Analysis.
With the proper front end, VSA covers RF and microwave ranges, plus it provides
additional modulation-domain analysis capability. These advancements are made
possible through digital technologies such as analog-to-digital conversion and
DSP that include digital intermediate frequency (IF) techniques and fast Fourier
transform (FFT) analysis.
Because the signals that people must analyze are growing in complexity, the
latest generations of signal analyzers have moved to a digital architecture and
often include many vector signal analysis and modulation analysis capabilities.
Some analyzers digitize the signal at the instrument input, after some amplifica-
tion, or after one or more downconverter stages. In most of today’s analyzers,
phase, as well as magnitude, is preserved in order to perform true vector mea-
surements. Other front ends, such as oscilloscopes and logic analyzers, digitize
the entire signal, while also maintaining phase and magnitude information. VSA
capability depends on the processing capability available to any of the front
ends, either as an integrated measurement personality or as software running
internally or on a computer connected to the front end.
VSA measurement
advantages
Vector analysis measures dynamic signals and produces
complex data results
VSA offers some distinct advantages over analog swept-tuned analysis. One
major VSA advantage is its ability to better measure dynamic signals. Dynamic
signals generally fall into one of two categories: time-varying or complex
modulated. Time-varying are signals whose measured properties change during
a measurement sweep (such as burst, gated, pulsed, or transient). Complex-
modulated signals cannot be solely described in terms of simple AM, FM, or PM
modulation, and include most of those used in digital communications, such as
quadrature amplitude modulation (QAM).
Figure 2. Swept-tuned analysis displays the instantaneous time response of a narrowband IF filter to
the input signal. Vector analysis uses FFT analysis to transform a set of time domain samples into
frequency domain spectra.
t
0
Display shows full
spectral display
A
f
f
1
f
2
Simulated parallel-filter processing
Time domain
Vector analysis
Fourier analysis
Frequency domain
Time record
Frequency
resolution
bandwidth
IF filter
Swept analysis
Carrier
Sweep span
Start frequency
Stop frequency
f
Time sampled data
A
Frequency spectrum
Vector Signal Analysis (continued)
5
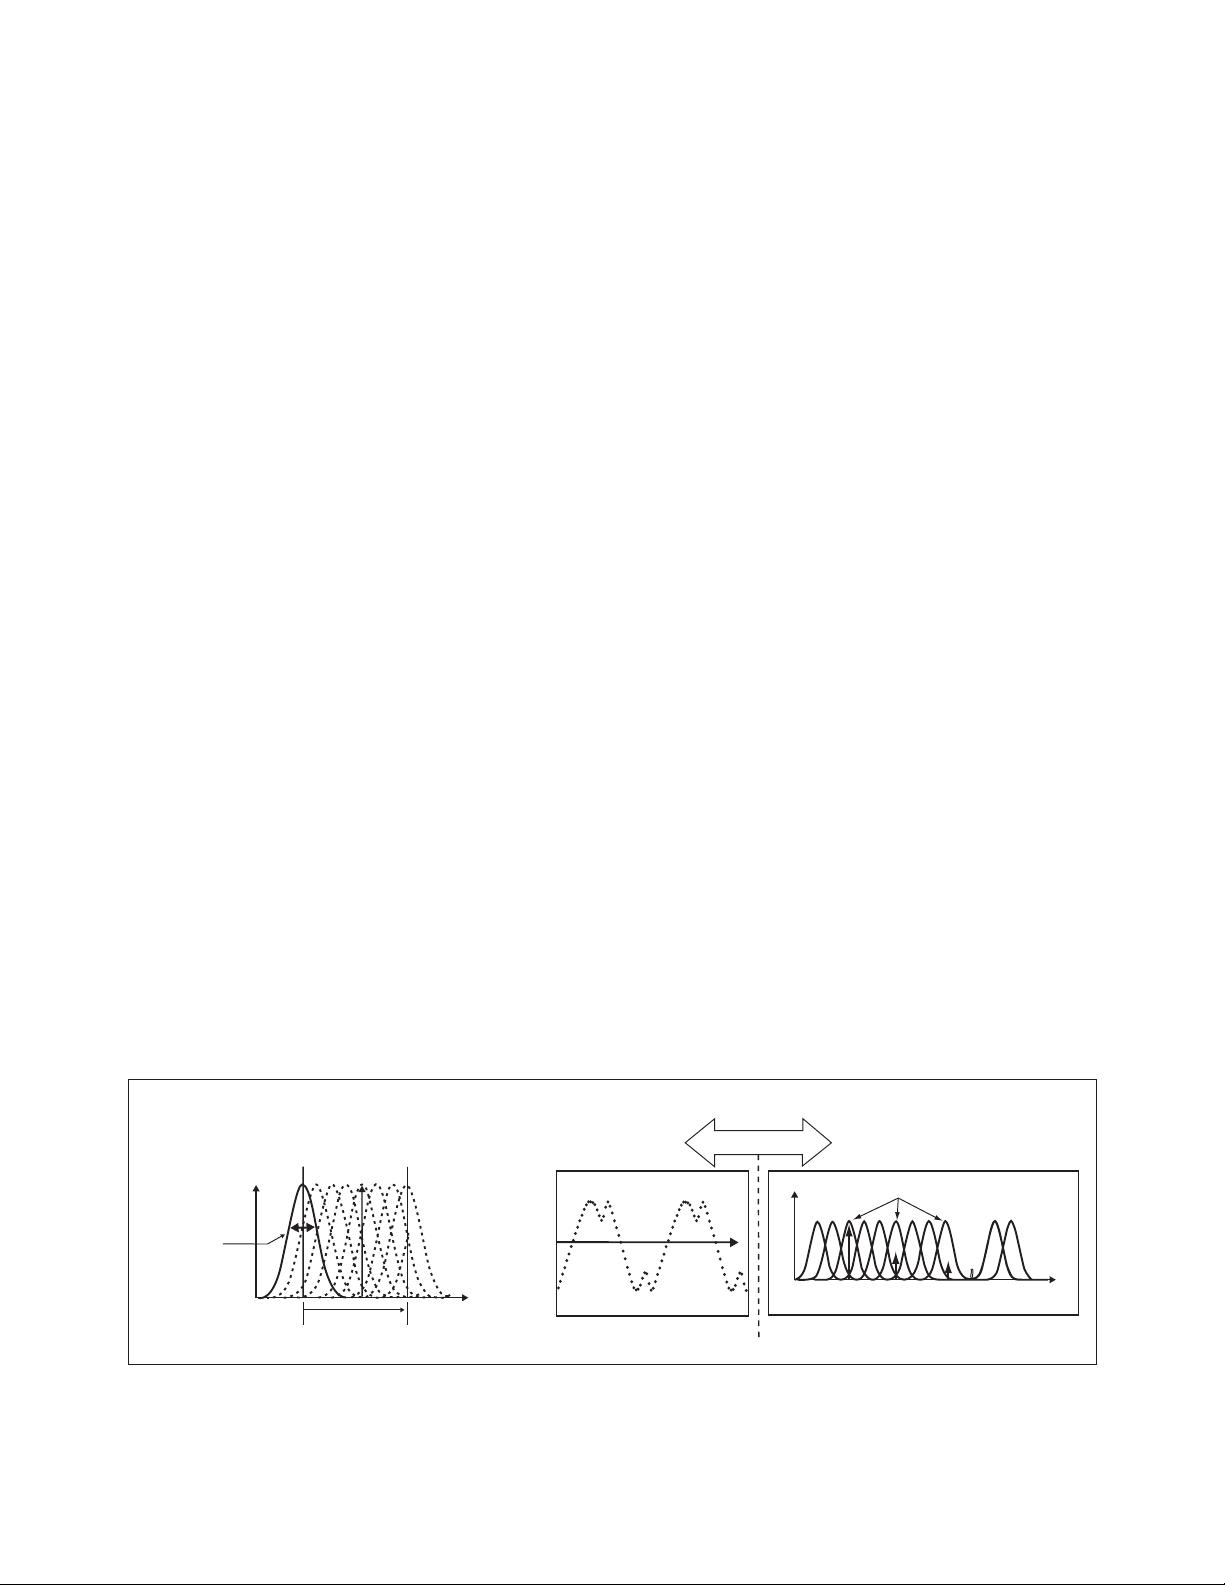
Traditional swept-spectrum analysis
1
, in effect, sweeps a narrowband filter
across a range of frequencies, sequentially measuring one frequency at a time.
Unfortunately, sweeping the input works well for stable or repetitive signals,
but will not accurately represent signals that change during the sweep. Also,
this technique only provides scalar (magnitude only) information, though some
other signal characteristics can be derived by further analysis of spectrum
measurements.
The VSA measurement process simulates a parallel bank of filters and over-
comes swept limitations by taking a “snapshot,” or time-record, of the signal;
then processing all frequencies simultaneously. For example, if the input is a
transient signal, the entire signal event is captured (meaning all aspects of
the signal at that moment in time are digitized and captured); then used by the
FFT to compute the “instantaneous” complex spectra versus frequency. This
process can be performed in real-time, that is, without missing any part of the
input signal. For these reasons, VSA is sometimes referred to as “dynamic signal
analysis” or “real-time signal analysis. The ability to track a fast-changing signal
with VSA, however, is not unlimited. It depends on the computation capability
available.
The VSA decreases measurement time
Parallel processing yields another potential advantage for high-resolution
(narrow resolution bandwidth) measurements: faster measurement time. If
you’ve used a swept-tuned spectrum analyzer before, you already know that
narrow resolution bandwidth (RBW) measurements of small frequency spans
can be very time-consuming. Swept-tuned analyzers sweep frequencies from
point to point slowly enough to allow the analog resolution bandwidth filters to
settle. By contrast, VSA measures across the entire frequency span at one time.
However, there is analogous VSA settling time due to the digital filters and DSP.
This means that the VSA sweep speed is limited by data collection and digital
processing time rather than analog filters. But this time is usually negligible
when compared to the settling time of analog filters. For certain narrow band-
width measurements, VSA can complete a measurement up to 1000 times faster
than conventional swept-tuned analysis.
In swept-tuned spectrum analysis, the physical bandwidth of the sweeping
filter limits the frequency resolution. VSA doesn’t have this limitation. VSA can
resolve signals that are spaced less than 100 μHz apart. Typically, VSA resolution
is limited by the signal and measurement front end’s frequency stability, as well
as by the amount of time you are willing to devote to the measurement. Increas-
ing the resolution also increases the time it takes to measure the signal (the
required time-record length).
Time-capture is a great tool for signal analysis and
troubleshooting
Another feature that is extremely useful is the time-capture capability. This
allows you to record actual signals in their entirety without gaps, and replay
them later for any type of data analysis. All measurement features can be ap-
plied to the captured signal. For example, you could capture a transmitted digital
communications signal and then perform both spectrum and vector-modulation
analysis to measure signal quality or identify signal impairments.
1. For more information on spectrum
analysis, see Keysight Application Note
150, Spectrum Analysis Basics, literature
number 5952-0292EN.
Vector analysis measures dynamic signals and produces
complex data results (continued)
剩余41页未读,继续阅读
天问123
- 粉丝: 0
- 资源: 4
上传资源 快速赚钱
- 我的内容管理 收起
- 我的资源 快来上传第一个资源
- 我的收益 登录查看自己的收益
- 我的积分 登录查看自己的积分
- 我的C币 登录后查看C币余额
- 我的收藏
- 我的下载
- 下载帮助
会员权益专享
最新资源
- RTL8188FU-Linux-v5.7.4.2-36687.20200602.tar(20765).gz
- c++校园超市商品信息管理系统课程设计说明书(含源代码) (2).pdf
- 建筑供配电系统相关课件.pptx
- 企业管理规章制度及管理模式.doc
- vb打开摄像头.doc
- 云计算-可信计算中认证协议改进方案.pdf
- [详细完整版]单片机编程4.ppt
- c语言常用算法.pdf
- c++经典程序代码大全.pdf
- 单片机数字时钟资料.doc
- 11项目管理前沿1.0.pptx
- 基于ssm的“魅力”繁峙宣传网站的设计与实现论文.doc
- 智慧交通综合解决方案.pptx
- 建筑防潮设计-PowerPointPresentati.pptx
- SPC统计过程控制程序.pptx
- SPC统计方法基础知识.pptx
资源上传下载、课程学习等过程中有任何疑问或建议,欢迎提出宝贵意见哦~我们会及时处理!
点击此处反馈
安全验证
文档复制为VIP权益,开通VIP直接复制
信息提交成功
评论0