
Python散点图与折线图绘制过程解析散点图与折线图绘制过程解析
这篇文章主要介绍了Python散点图与折线图绘制过程解析,文中通过示例代码介绍的非常详细,对大家的学习或者工作具有一定的参考学习价值,需要的朋友可以参考下
在数据分析的过程中,经常需要将数据可视化,目前常使用的:散点图 折线图
需要import的外部包 一个是绘图 一个是字体导入
import matplotlib.pyplot as plt
from matplotlib.font_manager import FontProperties
在数据处理前需要获取数据,从TXT XML csv excel 等文本中获取需要的数据,保存到list
def GetFeatureList(full_path_file):
file_name = full_path_file.split('\')[-1][0:4] # print(file_name)
# print(full_name)
K0_list = [] Area_list = [] all_lines = [] f = open(full_path_file,'r')
all_lines = f.readlines()
lines_num = len(all_lines)
# 数据清洗
if lines_num > 5000:
for i in range(3,lines_num-1):
temp_k0 = int(all_lines[i].split(' ')[1])
if temp_k0 == 0:
K0_list.append(ComputK0(all_lines[i]))
else:
K0_list.append(temp_k0)
Area_list.append(float(all_lines[i].split(' ')[15]))
# K0_Scatter(K0_list,Area_list,file_name)
else:
print('{} 该样本量少于5000'.format(file_name))
return K0_list, Area_list,file_name
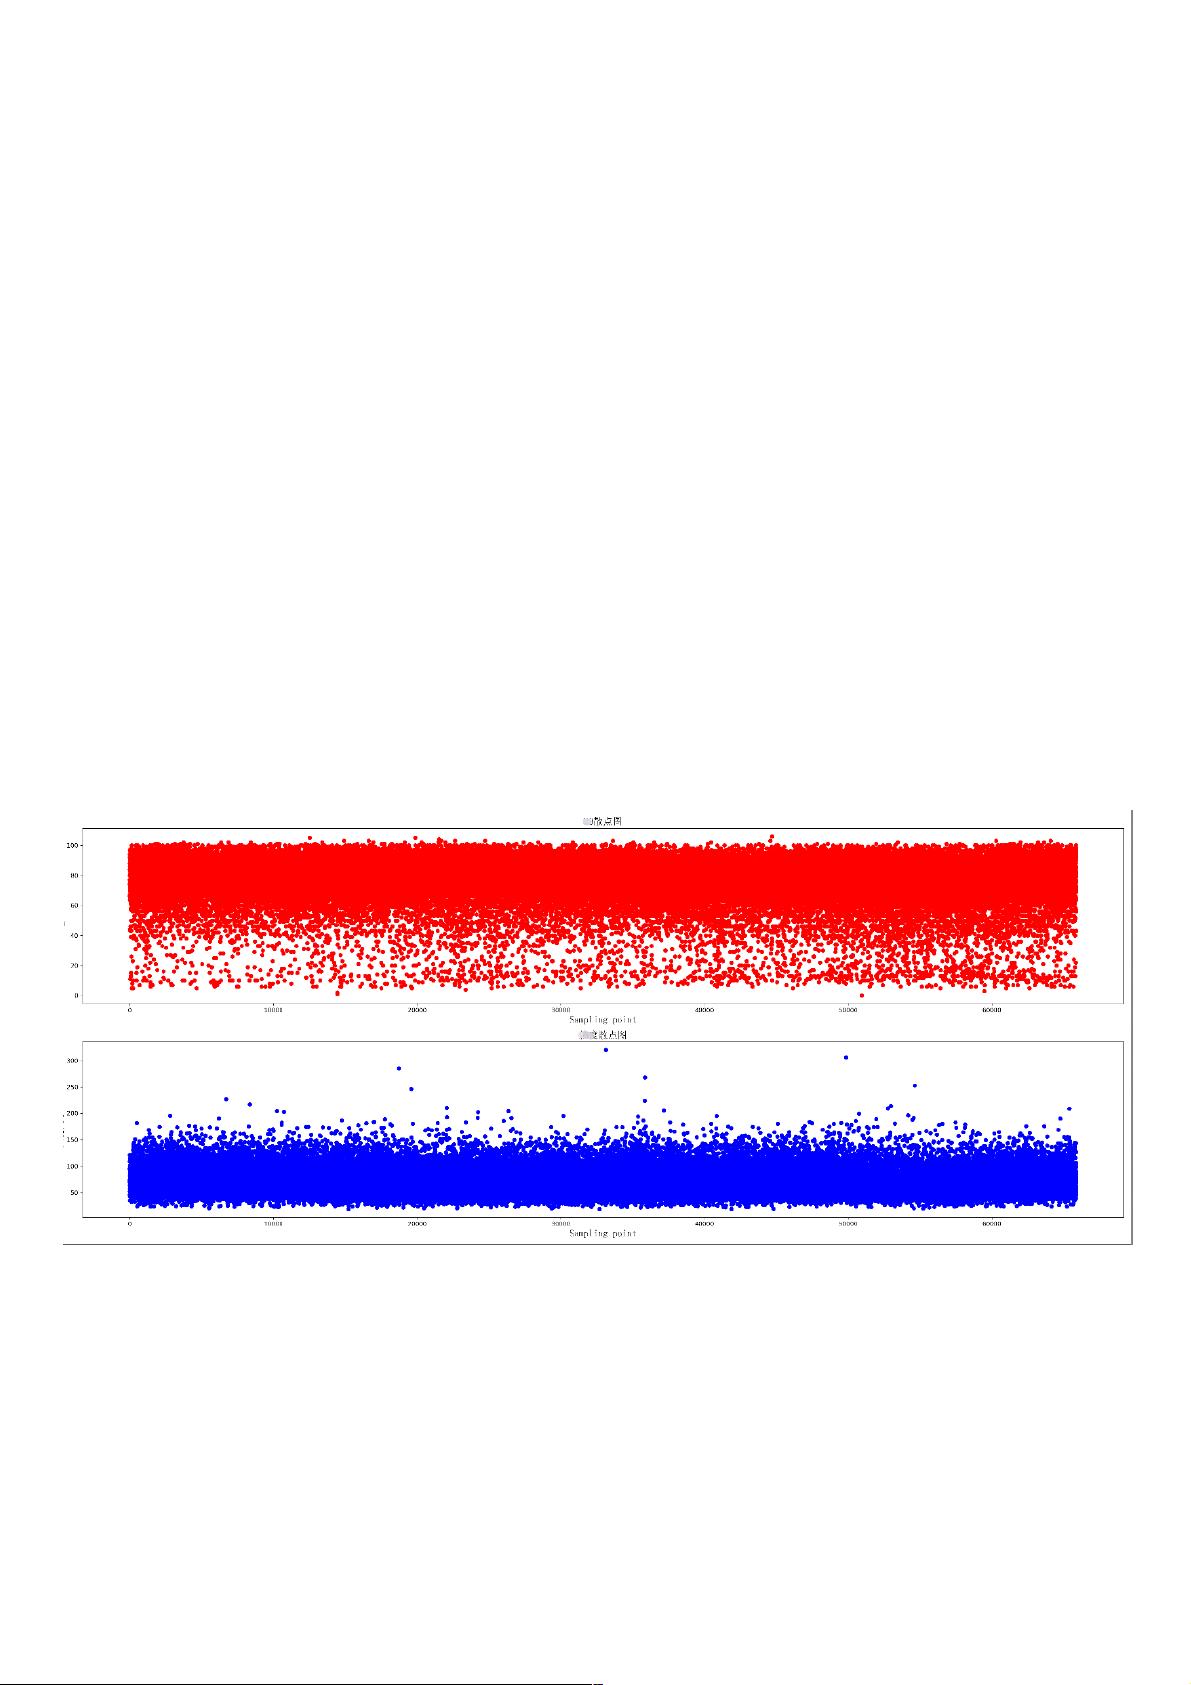
绘制两组数据的散点图,同时绘制两个散点图,上下分布在同一个图片中
def K0_Scatter(K0_list, area_list, pic_name):
plt.figure(figsize=(25, 10), dpi=300)
# 导入中文字体,及字体大小
zhfont = FontProperties(fname='C:/Windows/Fonts/simsun.ttc', size=16)
ax = plt.subplot(211)
# print(K0_list)
ax.scatter(range(len(K0_list)), K0_list, c='r', marker='o')
plt.title(u'散点图', fontproperties=zhfont)
plt.xlabel('Sampling point', fontproperties=zhfont)
plt.ylabel('K0_value', fontproperties=zhfont)
ax = plt.subplot(212)
ax.scatter(range(len(area_list)), area_list, c='b', marker='o')
plt.xlabel('Sampling point', fontproperties=zhfont)
plt.ylabel(u'大小', fontproperties=zhfont)
plt.title(u'散点图', fontproperties=zhfont)
# imgname = 'E:\' + pic_name + '.png'
# plt.savefig(imgname, bbox_inches = 'tight')
plt.show()
散点图显示
绘制一个折线图绘制一个折线图 每个数据增加标签每个数据增加标签
def K0_Plot(X_label, Y_label, pic_name):
plt.figure(figsize=(25, 10), dpi=300)
# 导入中文字体,及字体大小
zhfont = FontProperties(fname='C:/Windows/Fonts/simsun.ttc', size=16)
ax = plt.subplot(111)
# print(K0_list)
ax.plot(X_label, Y_label, c='r', marker='o')
plt.title(pic_name, fontproperties=zhfont)
plt.xlabel('coal_name', fontproperties=zhfont)
plt.ylabel(pic_name, fontproperties=zhfont)
# ax.xaxis.grid(True, which='major')
ax.yaxis.grid(True, which='major')
for a, b in zip(X_label, Y_label):
str_label = a + str(b) + '%'
plt.text(a, b, str_label, ha='center', va='bottom', fontsize=10)
imgname = 'E:\' + pic_name + '.png'
plt.savefig(imgname, bbox_inches = 'tight')
# plt.show()

weixin_38700779
- 粉丝: 10
- 资源: 924
 我的内容管理
收起
我的内容管理
收起
- 我的资源
快来上传第一个资源
 我的收益 登录查看自己的收益
 我的积分
登录查看自己的积分
我的积分
登录查看自己的积分
 我的C币
登录后查看C币余额
我的C币
登录后查看C币余额
 我的收藏
我的收藏  我的下载
我的下载  下载帮助
下载帮助

会员权益专享


最新资源
- 27页智慧街道信息化建设综合解决方案.pptx
- 计算机二级Ms-Office选择题汇总.doc
- 单链表的插入和删除实验报告 (2).docx
- 单链表的插入和删除实验报告.pdf
- 物联网智能终端项目设备管理方案.pdf
- 如何打造品牌的模式.doc
- 样式控制与页面布局.pdf
- 武汉理工Java实验报告(二).docx
- 2021线上新品消费趋势报告.pdf
- 第3章 Matlab中的矩阵及其运算.docx
- 基于Web的人力资源管理系统的必要性和可行性.doc
- 基于一阶倒立摆的matlab仿真实验.doc
- 速运公司物流管理模式研究教材
- 大数据与管理.pptx
- 单片机课程设计之步进电机.doc
- 大数据与数据挖掘.pptx
资源上传下载、课程学习等过程中有任何疑问或建议,欢迎提出宝贵意见哦~我们会及时处理!
点击此处反馈


评论0