没有合适的资源?快使用搜索试试~ 我知道了~
首页Two-Dimensional Phase Unwrapping Problem
Two-Dimensional Phase Unwrapping Problem
需积分: 9 10 下载量 33 浏览量
更新于2023-03-16
评论
收藏 3.48MB PDF 举报
Two-Dimensional Phase Unwrapping Problem,By Dr. Munther Gdeisat and Dr. Francis Lilley 二维相位展开相关内容,主要是误差分析,内含matlab代码实现
资源详情
资源评论
资源推荐
1
Two-Dimensional Phase Unwrapping Problem
By Dr. Munther Gdeisat and Dr. Francis Lilley
Pre-requisite: In order to understand this tutorial it is necessary for you to have already studied and
completed the “one-dimensional phase unwrapping problem” tutorial before reading this document.
There are many applications that produce wrapped phase images. Examples of these are synthetic aperture
radar (SAR), magnetic resonance imaging (MRI) and fringe pattern analysis. The wrapped phase images that
are produced by these applications are not usable unless they are first unwrapped so as to form a
continuous phase map. This means that the development of a robust phase unwrapping algorithm is an
important topic for all these applications. In this article, we will not discuss phase unwrapping only in the
specific context of these applications, but we will instead explain the concept of the 2D phase unwrapping
problem in general terms.
1. Introduction to 2D phase unwrapping
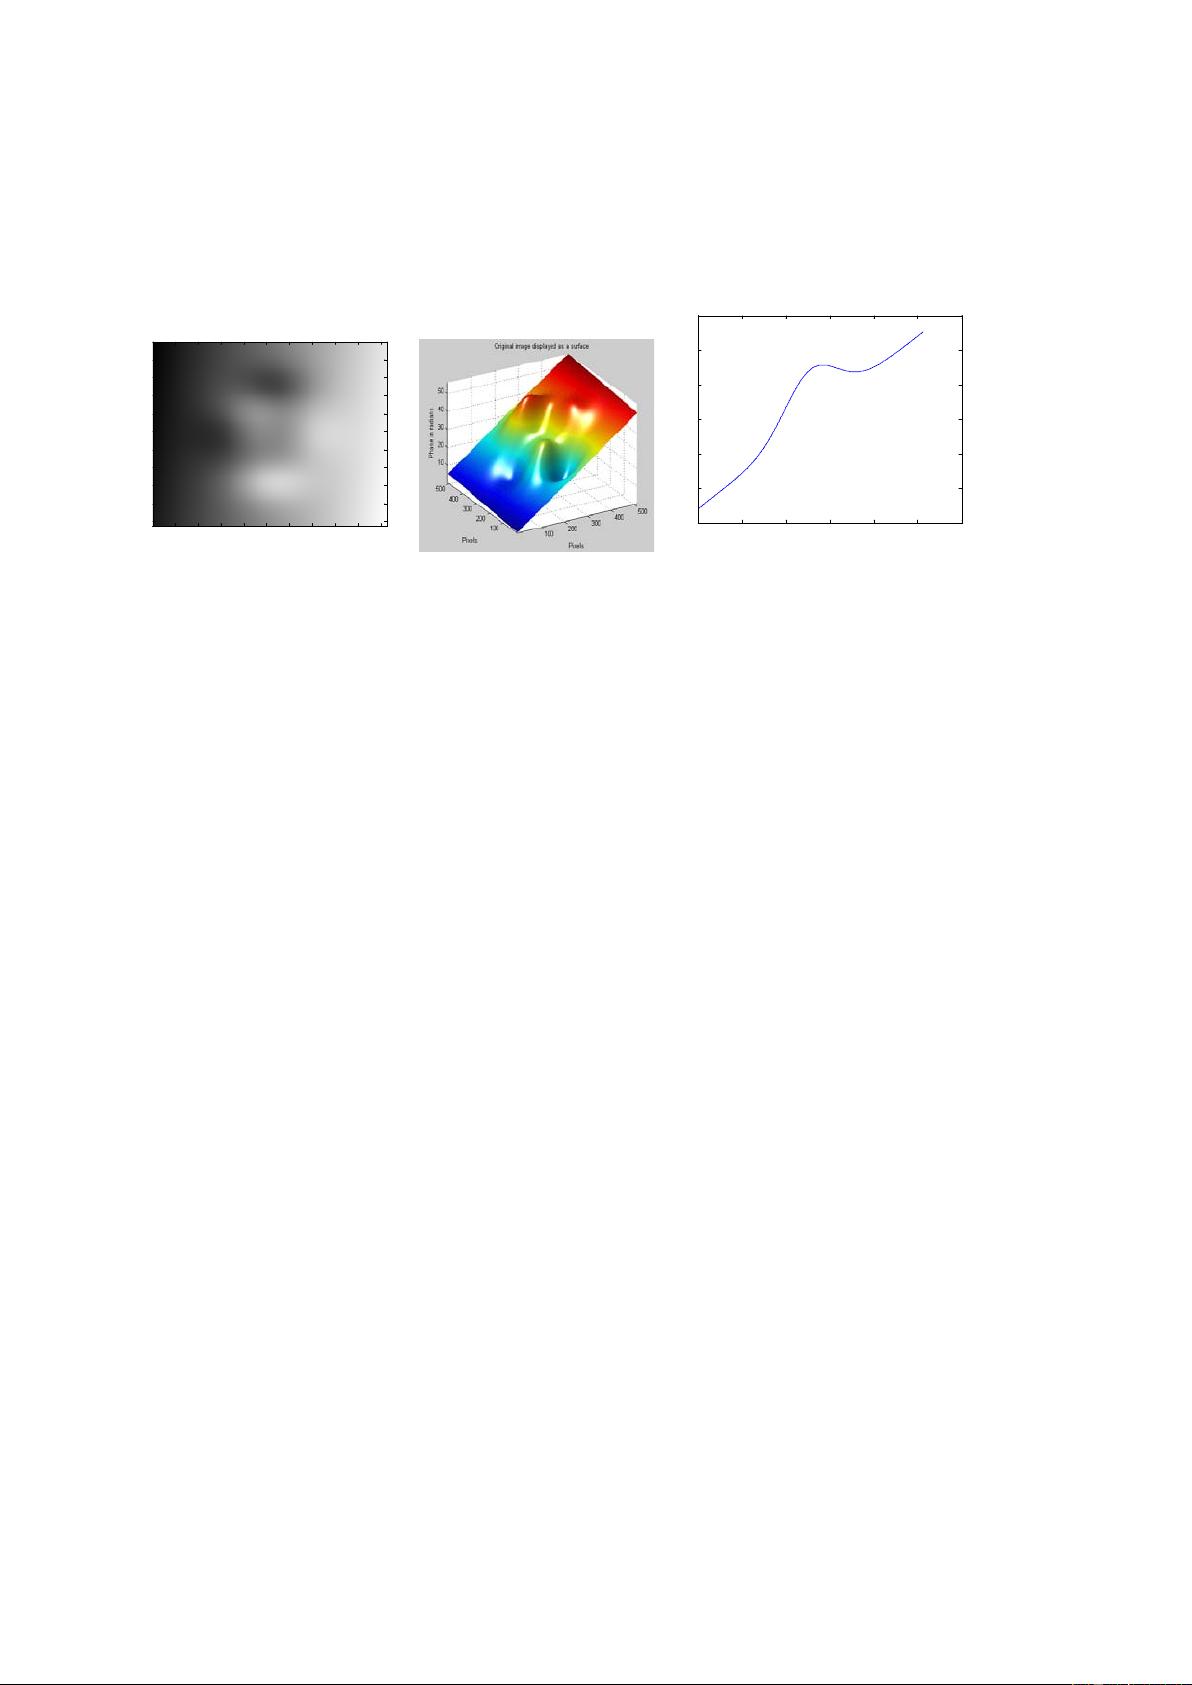
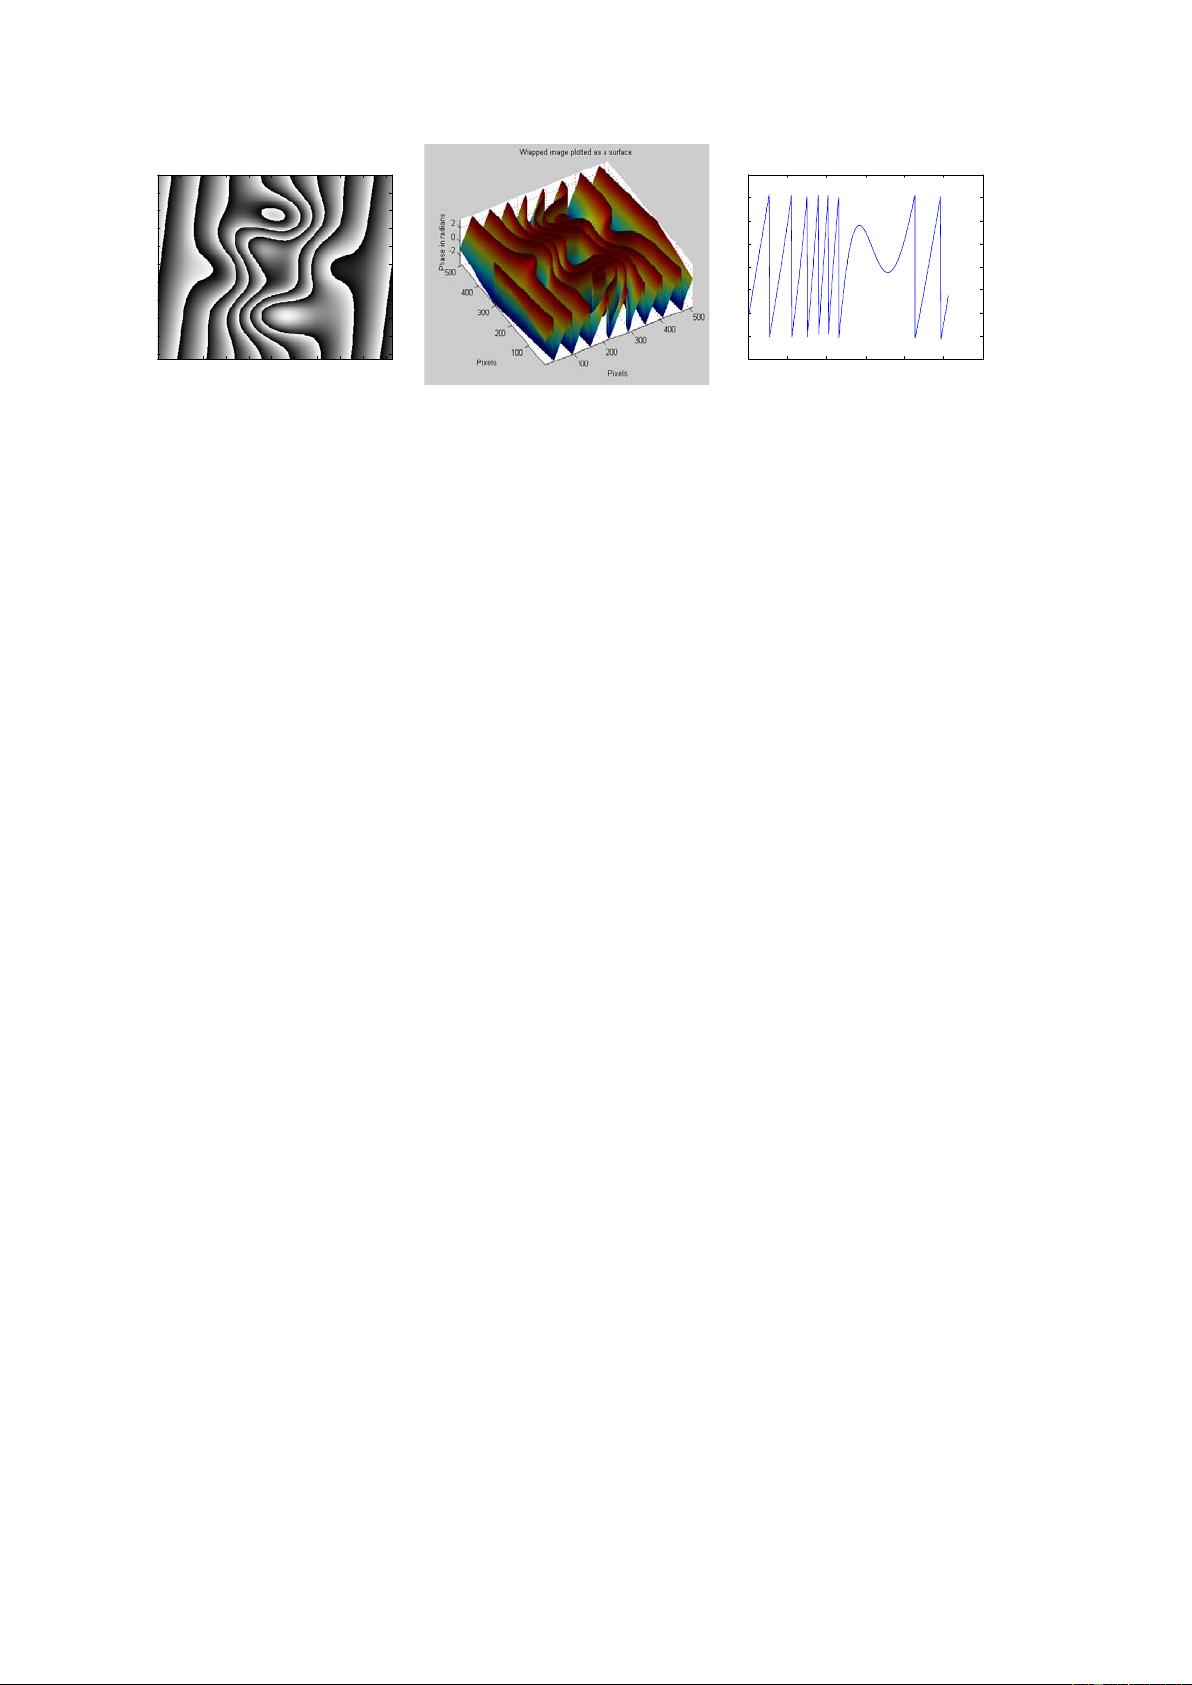
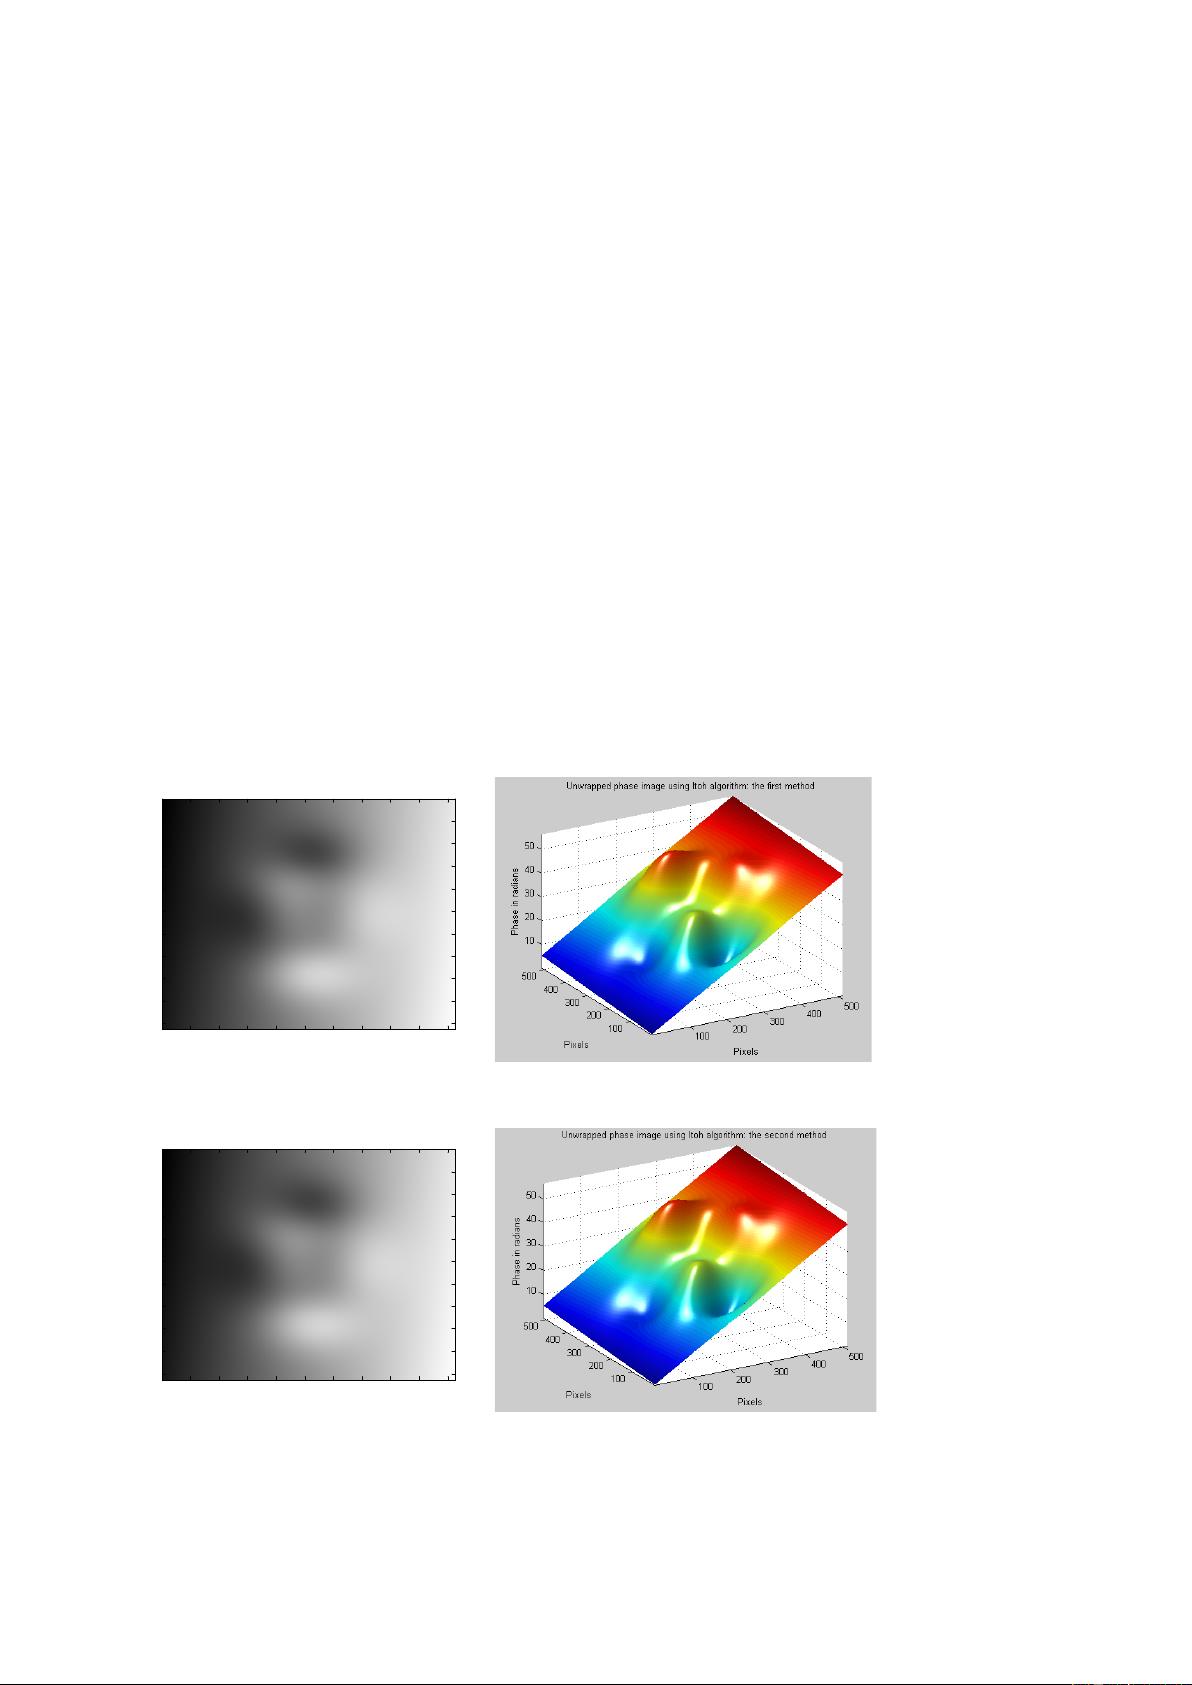
We shall explain the 2D phase unwrapping process as follows. Suppose that we have a computer-generated
continuous phase image that does not contain any phase wraps (2π jumps). This image may be displayed as
a visual intensity array, as shown in Figure 1(a). The same image may also be plotted as a 3D surface, as
shown in Figure 1(b). The intensities from a single row of this image (row 410) are graphically plotted in
Figure 1(c). The Matlab code that is used to generate this phase image is as follows. The peaks Matlab
function is used to generate the continuous phase image. Please note that we are using the term
“continuous” here to refer not to an analogue signal, but to a discrete 1D phase signal, or a discrete 2D
phase image, that does not contain any phase wraps.
%This program is to simulate a continuous phase distribution to act as a dataset
%for use in the 2D phase unwrapping problem
clc; close all; clear
N = 512;
[x,y]=meshgrid(1:N);
image1 = 2*peaks(N) + 0.1*x + 0.01*y;
figure, colormap(gray(256)), imagesc(image1)
title('Continuous phase image displayed as a visual intensity array')
xlabel('Pixels'), ylabel('Pixels')
figure
surf(image1,'FaceColor','interp', 'EdgeColor','none', 'FaceLighting','phong')
view(-30,30), camlight left, axis tight
title(' Continuous phase map image displayed as a surface plot')
xlabel('Pixels'), ylabel('Pixels'), zlabel('Phase in radians')
figure, plot(image1(410,:))
title('Row 410 of the continuous phase image')
xlabel('Pixels'), ylabel('Phase in radians')
2
(a) (b) (c)
Figure 1: (a) A computer-generated continuous phase image displayed as a visual intensity array, (b) the
same image plotted as a surface, (c) intensities from row 410 of the phase image.
Now let us wrap the computer-generated continuous phase image. The Matlab code to perform this task is
as follows;
%wrap the 2D image
image1_wrapped = atan2(sin(image1), cos(image1));
figure, colormap(gray(256)), imagesc(image1_wrapped)
title('Wrapped phase image displayed as a visual intensity array')
xlabel('Pixels'), ylabel('Pixels')
figure
surf(image1_wrapped,'FaceColor','interp', 'EdgeColor','none',
'FaceLighting','phong')
view(-30,70), camlight left, axis tight
title('Wrapped phase image plotted as a surface')
xlabel('Pixels'), ylabel('Pixels'), zlabel('Phase in radians')
figure, plot(image1_wrapped(410,:))
title('Row 410 of the wrapped phase image')
xlabel('Pixels'), ylabel('Phase in radians')
The wrapped image is shown below.
Original image displayed as visual intensity array
Pixels
Pixels
50 100 150 200 250 300 350 400 450 500
50
100
150
200
250
300
350
400
450
500
0
100
200
300
400
500
600
0
10
20
30
40
50
60
Row 410 of the original image
Pixels
Phase in radians
3
(a) (b) (c)
Figure 2: (a) A wrapped phase image displayed as a visual intensity array, (b) the wrapped image plotted as
a surface, (c) row 410 of the wrapped phase image.
Recall from the 1D phase unwrapping tutorial, that when we were dealing with lines of phase values, the
phase wraps appeared as multiple 2π jumps forming a saw-tooth waveform like that shown in Figure 2(c).
Note that in the 2D case, where we now have phase images in the form of a 2D array, the phase wraps
appear as contour curves, as shown in Figure 2(a), which we shall refer to as wrap curves. These curves will
appear in the form of either closed, or open, curves and you can see both types of curve in Figure 2(a).
Note that in the latter case, if an open curve enters a wrapped phase image, it must therefore also leave it.
In order to unwrap the image we can use the Itoh 2D phase unwrapper. There are two main methods by
which the Itoh 2D phase unwrapper may be implemented. The first method involves unwrapping the rows
in the wrapped image sequentially (one at a time). This produces an intermediate image that is only
partially phase unwrapped. Next we perform a similar process, but this time unwrap all the columns within
the partially unwrapped image. The resultant unwrapped phase image, as produced by this first
implementation of the Itoh unwrapper, is shown in Figures 3(a) & (b). The Matlab code to perform this task
is as follows.
%Unwrap the image using the Itoh algorithm: the first method is performed
%by first sequentially unwrapping the all rows, one at a time.
image1_unwrapped = image1_wrapped;
for i=1:N
image1_unwrapped(i,:) = unwrap(image1_unwrapped(i,:));
end
%Then sequentially unwrap all the columns one at a time
for i=1:N
image1_unwrapped(:,i) = unwrap(image1_unwrapped(:,i));
end
figure, colormap(gray(256)), imagesc(image1_unwrapped)
title('Unwrapped phase image using the Itoh algorithm: the first method')
xlabel('Pixels'), ylabel('Pixels')
figure
surf(image1_unwrapped,'FaceColor','interp', 'EdgeColor','none',
'FaceLighting','phong')
view(-30,30), camlight left, axis tight
title('Unwrapped phase image using the Itoh algorithm: the first method')
xlabel('Pixels'), ylabel('Pixels'), zlabel('Phase in radians')
Wrapped image displayed as visual intensity array
Pixels
Pixels
50 100 150
200
250
300 350
400 450 500
50
100
150
200
250
300
350
400
450
500
0 100 200 300 400
500 600
-4
-3
-2
-1
0
1
2
3
4
Row 410 of the wrapped image
Pixels
Phase in radians
4
The second method of implementing the Itoh unwrapper simply works the other way around. In other
words, it involves first unwrapping all the columns within the wrapped phase image, one at a time. And this
again produces a partially phase unwrapped image. Then we sequentially unwrap all rows of the partially
unwrapped image. The resultant unwrapped phase image, produced using this second implementation of
the Itoh unwrapper, is shown in Figure 3(b). The Matlab code to perform this task is as follows.
%Unwrap the image using the Itoh algorithm: the second method
%performed by first sequentially unwrapping all the columns one at a time.
image2_unwrapped = image1_wrapped;
for i=1:N
image2_unwrapped(:,i) = unwrap(image2_unwrapped(:,i));
end
%Then sequentially unwrap all the a rows one at a time
for i=1:N
image2_unwrapped(i,:) = unwrap(image2_unwrapped(i,:));
end
figure, colormap(gray(256)), imagesc(image2_unwrapped)
title('Unwrapped phase image using Itoh algorithm: the second method')
xlabel('Pixels'), ylabel('Pixels')
figure
surf(image2_unwrapped,'FaceColor','interp', 'EdgeColor','none',
'FaceLighting','phong')
view(-30,30), camlight left, axis tight
title('Unwrapped phase image using the Itoh algorithm: the second method')
xlabel('Pixels'), ylabel('Pixels'), zlabel('Phase in radians')
(a) (b)
(c) (d)
Figure 3: Unwrapped image using the 2D Itoh algorithm; implemented using the first method in (a) & (b),
and implemented using the second method in (c) & (d).
unwrapped image
Pixels
Pixels
50 100 150 200 250 300 350 400 450 500
50
100
150
200
250
300
350
400
450
500
unwrapped image
Pixels
Pixels
50 100 150 200 250 300 350 400 450 500
50
100
150
200
250
300
350
400
450
500
5
It is obvious from the exercise that has been performed above that both of these implementations of the
Itoh phase unwrapping algorithm actually produce the same output. This is because this wrapped phase
image is not a real one, but is instead an artificial dataset that does not contain any errors.
The wrapped phase image that is shown in Figure 2(a) is a good example of an ideal phase image that does
not contain any sources of error. We can easily process this image using any 2D phase unwrapper. As has
been explained above, in this case we have processed the image using the 2D Itoh algorithm. This is a very
simple phase unwrapping algorithm, which only works in cases where the phase images are virtually error
free. Most real-world applications produce wrapped phase images that do contain errors. In this case, we
need to use more complex 2D phase unwrappers in order to deal with these images.
In 2D phase unwrapping, there are four sources of errors that complicate the phase unwrapping process.
These sources of errors are as follows.
1. Noise
2. Under sampling
3. When the continuous phase image contains sudden, abrupt phase changes
4. Errors produced by the phase extraction algorithm itself
In this tutorial we will discuss only the first three sources of errors and their effects upon the 2D phase
unwrapping process. We will also explain how to successfully unwrap images in these three different
situations. The fourth source of error depends on the specific algorithm that is used to extract the wrapped
phase. The reader should be aware of this as another potential source of error when performing phase
unwrapping, however a detailed discussion of the effects of an algorithm itself on the extracted wrapped
phase is out of the scope of this tutorial and will not be covered here.
剩余31页未读,继续阅读
one_meter_laser
- 粉丝: 0
- 资源: 1
上传资源 快速赚钱
- 我的内容管理 收起
- 我的资源 快来上传第一个资源
- 我的收益 登录查看自己的收益
- 我的积分 登录查看自己的积分
- 我的C币 登录后查看C币余额
- 我的收藏
- 我的下载
- 下载帮助
会员权益专享
最新资源
- 2023年中国辣条食品行业创新及消费需求洞察报告.pptx
- 2023年半导体行业20强品牌.pptx
- 2023年全球电力行业评论.pptx
- 2023年全球网络安全现状-劳动力资源和网络运营的全球发展新态势.pptx
- 毕业设计-基于单片机的液体密度检测系统设计.doc
- 家用清扫机器人设计.doc
- 基于VB+数据库SQL的教师信息管理系统设计与实现 计算机专业设计范文模板参考资料.pdf
- 官塘驿林场林防火(资源监管)“空天地人”四位一体监测系统方案.doc
- 基于专利语义表征的技术预见方法及其应用.docx
- 浅谈电子商务的现状及发展趋势学习总结.doc
- 基于单片机的智能仓库温湿度控制系统 (2).pdf
- 基于SSM框架知识产权管理系统 (2).pdf
- 9年终工作总结新年计划PPT模板.pptx
- Hytera海能达CH04L01 说明书.pdf
- 数据中心运维操作标准及流程.pdf
- 报告模板 -成本分析与报告培训之三.pptx
资源上传下载、课程学习等过程中有任何疑问或建议,欢迎提出宝贵意见哦~我们会及时处理!
点击此处反馈
安全验证
文档复制为VIP权益,开通VIP直接复制
信息提交成功
评论0