没有合适的资源?快使用搜索试试~ 我知道了~
首页2019-R语言新书 Advanced R Statistical Programming and Data Models
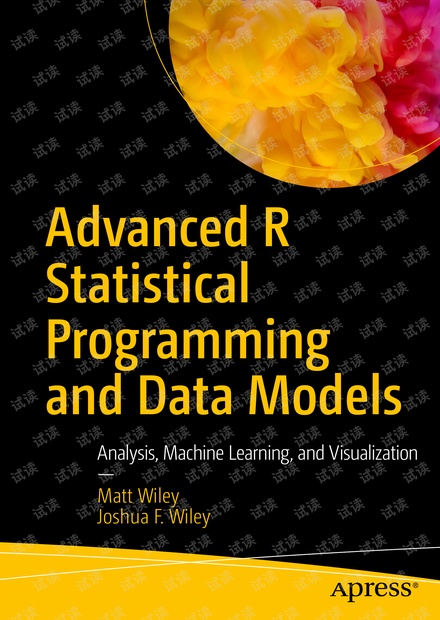
2019-R语言新书 Advanced R Statistical Programming and Data Models_ Analysis, Machine Learning, and Visualization-Apress (2019),R语言中2019年新出来的书!!非常的好
资源详情
资源评论
资源推荐

Advanced R
Statistical
Programming
and Data Models
Analysis, Machine Learning, and Visualization
—
Matt Wiley
Joshua F. Wiley

Matt Wiley
Joshua F. Wiley
Advanced R Statistical
Programming and
Data Models
Analysis, Machine Learning,
and Visualization

Advanced R Statistical Programming and Data Models: Analysis, Machine Learning,
and Visualization
ISBN-13 (pbk): 978-1-4842-2871-5 ISBN-13 (electronic): 978-1-4842-2872-2
https://doi.org/10.1007/978-1-4842-2872-2
Library of Congress Control Number: 2019932986
Copyright © 2019 by Matt Wiley and Joshua F. Wiley
is work is subject to copyright. All rights are reserved by the Publisher, whether the whole or part of the
material is concerned, specically the rights of translation, reprinting, reuse of illustrations, recitation,
broadcasting, reproduction on microlms or in any other physical way, and transmission or information
storage and retrieval, electronic adaptation, computer software, or by similar or dissimilar methodology now
known or hereafter developed.
Trademarked names, logos, and images may appear in this book. Rather than use a trademark symbol with
every occurrence of a trademarked name, logo, or image we use the names, logos, and images only in an
editorial fashion and to the benet of the trademark owner, with no intention of infringement of the
trademark.
e use in this publication of trade names, trademarks, service marks, and similar terms, even if they are not
identied as such, is not to be taken as an expression of opinion as to whether or not they are subject to
proprietary rights.
While the advice and information in this book are believed to be true and accurate at the date of publication,
neither the authors nor the editors nor the publisher can accept any legal responsibility for any errors or
omissions that may be made. e publisher makes no warranty, express or implied, with respect to the
material contained herein.
Managing Director, Apress Media LLC: Welmoed Spahr
Acquisitions Editor: Steve Anglin
Development Editor: Matthew Moodie
Coordinating Editor: Mark Powers
Cover designed by eStudioCalamar
Cover image designed by Freepik (www.freepik.com)
Distributed to the book trade worldwide by Springer Science+Business Media NewYork, 233 Spring Street,
6th Floor, NewYork, NY 10013. Phone 1-800-SPRINGER, fax (201) 348-4505, e-mail orders-ny@springer-
sbm.com, or visit www.springeronline.com. Apress Media, LLC is a California LLC and the sole member
(owner) is Springer Science + Business Media Finance Inc (SSBM Finance Inc). SSBM Finance Inc is a
Delaware corporation.
For information on translations, please e-mail editorial@apress.com; for reprint, paperback, or audio rights,
please email bookpermissions@springernature.com.
Apress titles may be purchased in bulk for academic, corporate, or promotional use. eBook versions and
licenses are also available for most titles. For more information, reference our Print and eBook Bulk Sales
web page at http://www.apress.com/bulk-sales.
Any source code or other supplementary material referenced by the author in this book is available to
readers on GitHub via the book's product page, located at www.apress.com/9781484228715. For more
detailed information, please visit http://www.apress.com/source-code.
Printed on acid-free paper
MattWiley
Columbia City, IN, USA
JoshuaF.Wiley
Columbia City, IN, USA

iii
Table of Contents
Chapter 1: Univariate Data Visualization ������������������������������������������������������������������ 1
1.1 Distribution ................................................................................................................. 2
Visualizing the Observed Distribution .................................................................................... 2
Stacked Dot Plots and Histograms ......................................................................................... 2
Density Plots .......................................................................................................................... 6
Comparing the Observed Distribution with Expected Distributions ....................................... 9
Q-Q Plots ................................................................................................................................ 9
Density Plots ........................................................................................................................ 14
Fitting More Distributions .................................................................................................... 15
1.2 Anomalous Values .................................................................................................... 21
1.3 Summary .................................................................................................................. 30
Chapter 2: Multivariate Data Visualization ������������������������������������������������������������� 33
2.1 Distribution ............................................................................................................... 34
2.2 Anomalous Values .................................................................................................... 40
2.3 Relations Between Variables .................................................................................... 44
Assessing Homogeneity of Variance .................................................................................... 53
2.4 Summary .................................................................................................................. 59
About the Authors ���������������������������������������������������������������������������������������������������� ix
About the Technical Reviewer ��������������������������������������������������������������������������������� xi
Acknowledgments ������������������������������������������������������������������������������������������������� xiii
Introduction �������������������������������������������������������������������������������������������������������������xv

iv
Chapter 3: GLM 1 ���������������������������������������������������������������������������������������������������� 61
3.1 Conceptual Background ........................................................................................... 62
3.2 Categorical Predictors and Dummy Coding .............................................................. 65
Two-Level Categorical Predictors ........................................................................................ 65
Three- or More Level Categorical Predictors ....................................................................... 66
3.3 Interactions and Moderated Effects ......................................................................... 68
3.4 Formula Interface ..................................................................................................... 70
3.5 Analysis of Variance ................................................................................................. 72
Conceptual Background ....................................................................................................... 72
ANOVA in R ........................................................................................................................... 76
3.6 Linear Regression .................................................................................................... 79
Conceptual Background ....................................................................................................... 80
Linear Regression in R ......................................................................................................... 82
High-Performance Linear Regression .................................................................................. 99
3.7 Controlling for Confounds ....................................................................................... 102
3.8 Case Study: Multiple Linear Regression with Interactions ..................................... 113
3.9 Summary ................................................................................................................ 121
Chapter 4: GLM 2 �������������������������������������������������������������������������������������������������� 123
4.1 Conceptual Background ......................................................................................... 124
Logistic Regression ............................................................................................................ 124
Count Regression ............................................................................................................... 126
4.2 R Examples ............................................................................................................. 128
Binary Logistic Regression ................................................................................................ 129
Ordered Logistic Regression .............................................................................................. 136
Multinomial Logistic Regression ........................................................................................ 140
Poisson and Negative Binomial Regression ....................................................................... 145
4.3 Case Study: Multinomial Logistic Regression ........................................................ 153
4.4 Summary ................................................................................................................ 162
Table of ConTenTs
剩余648页未读,继续阅读
Harry-Porter
- 粉丝: 4
- 资源: 15
上传资源 快速赚钱
 我的内容管理
收起
 我的资源
快来上传第一个资源
 我的收益 登录查看自己的收益
 我的积分
登录查看自己的积分
 我的C币
登录后查看C币余额
 我的收藏
我的收藏  我的下载
我的下载  下载帮助
下载帮助

会员权益专享
最新资源
- c++校园超市商品信息管理系统课程设计说明书(含源代码) (2).pdf
- 建筑供配电系统相关课件.pptx
- 企业管理规章制度及管理模式.doc
- vb打开摄像头.doc
- 云计算-可信计算中认证协议改进方案.pdf
- [详细完整版]单片机编程4.ppt
- c语言常用算法.pdf
- c++经典程序代码大全.pdf
- 单片机数字时钟资料.doc
- 11项目管理前沿1.0.pptx
- 基于ssm的“魅力”繁峙宣传网站的设计与实现论文.doc
- 智慧交通综合解决方案.pptx
- 建筑防潮设计-PowerPointPresentati.pptx
- SPC统计过程控制程序.pptx
- SPC统计方法基础知识.pptx
- MW全能培训汽轮机调节保安系统PPT教学课件.pptx
资源上传下载、课程学习等过程中有任何疑问或建议,欢迎提出宝贵意见哦~我们会及时处理!
点击此处反馈


安全验证
文档复制为VIP权益,开通VIP直接复制
 信息提交成功
评论0