Matlab图像处理基础操作与高级技巧源码解析
110 浏览量
更新于2024-06-27
收藏 2.03MB DOC 举报
"Matlab图像处理入门到精通源代码文档详细介绍了使用Matlab进行图像处理的基本操作和高级技术。本教程涵盖了多个章节,从基础操作如图像代数运算(如相加、相减、相乘、除以常数)开始,逐步深入到图像的几何变换(如缩放、旋转、剪切、仿射变换)、局部特征提取(如局部标准差计算、邻域像素值最大值查找)和区域选择与操作(如六边形区域选择、灰度分割、锐化滤波和填充)。
第3章重点在于图像变换,包括如何使用findbounds、makeresampler和投影变换等函数进行精确的图像调整。这些技巧对于处理实际图像数据时非常实用,能够帮助用户灵活地操控图像的尺寸和布局。
第4章涉及的是频域处理,包括矩形连续函数的傅立叶变换、离散余弦变换以及JPEG图像压缩的相关概念。通过构建矩形函数并进行二维快速傅立叶变换,学习者可以理解频域分析在图像处理中的应用。此外,还演示了如何利用这些变换寻找特定目标的位置,如在图像中定位特定字母。
章节4.3探讨了Radon变换,这是一种用于检测图像中的直线或边缘的技术,以及其在图像重建和直线检测中的作用。通过正方形图像的Radon变换实例,读者能了解到这种变换如何揭示图像的不同角度视图。
此外,文档还包含了函数poly2mask的使用方法,这对于基于区域的图像操作至关重要,比如目标检测和区域填充。最后,对于初学者来说,清晰的函数调用格式和具体示例,如函数fftshift和ifft2的使用,有助于理解和实践傅立叶变换的操作。
这份Matlab图像处理源代码文档提供了一个系统的学习路径,适合希望深入理解并掌握Matlab图像处理技术的读者,无论是初学者还是有一定经验的工程师,都能从中找到有价值的内容和实践案例。"
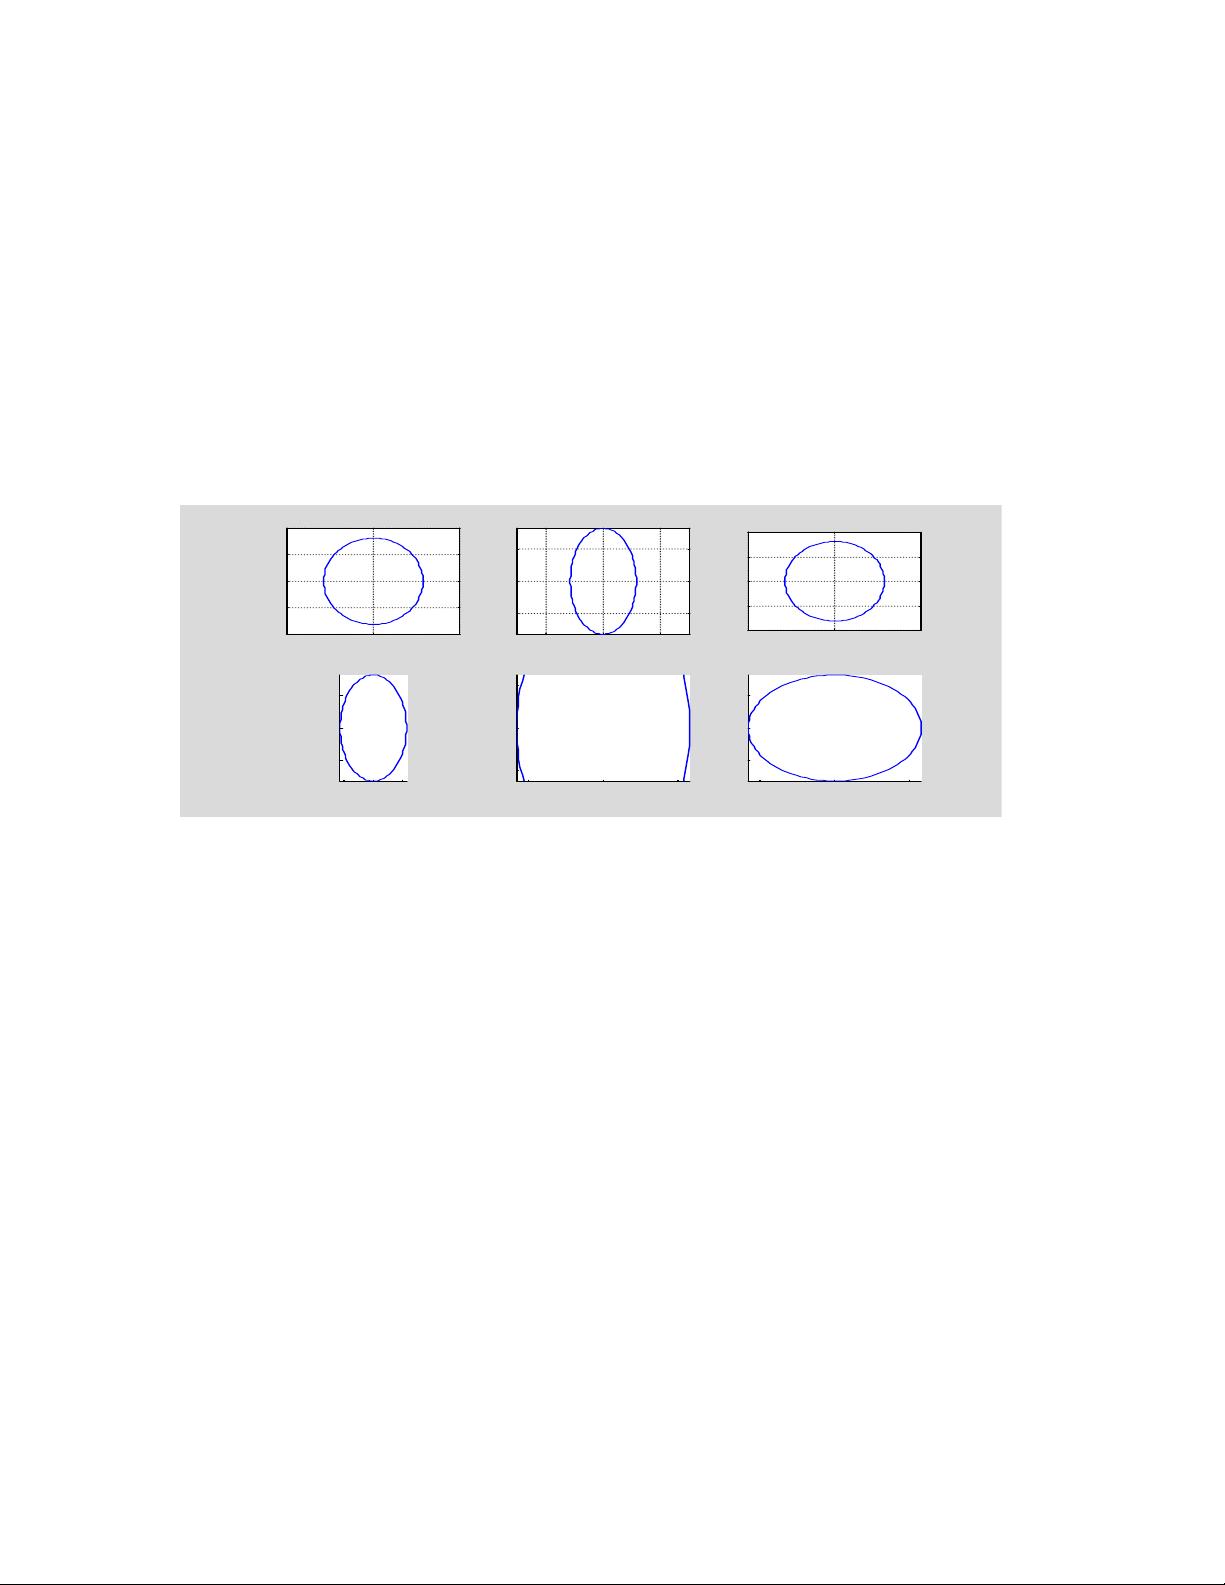
【*例 7.2.3.1-1】观察各种轴控制指令的影响。演示采用长轴为 3.25,短轴为 1.15
的椭圆。注意:采用多子图表现时,图形形状不仅受“控制指令”影响,而且受整个
图面“宽高比”及“子图数目”的影响。本书这样处理,是出于篇幅考虑。读者欲想准
确体会控制指令的影响,请在全图状态下进行观察。
t=0:2*pi/99:2*pi;
x=1.15*cos(t);y=3.25*sin(t); %y 为长轴,x 为短轴
subplot(2,3,1),plot(x,y),axis normal,grid on,
title('Normal and Grid on')
subplot(2,3,2),plot(x,y),axis equal,grid on,title('Equal')
subplot(2,3,3),plot(x,y),axis square,grid on,title('Square')
subplot(2,3,4),plot(x,y),axis image,box off,title('Image and Box off')
subplot(2,3,5),plot(x,y),axis image fill,box off
title('Image and Fill')
subplot(2,3,6),plot(x,y),axis tight,box off,title('Tight')
图 7.2.3.1-1 各种轴控制指令的不同影响
7.2.3.2 刻度、分格线和坐标框
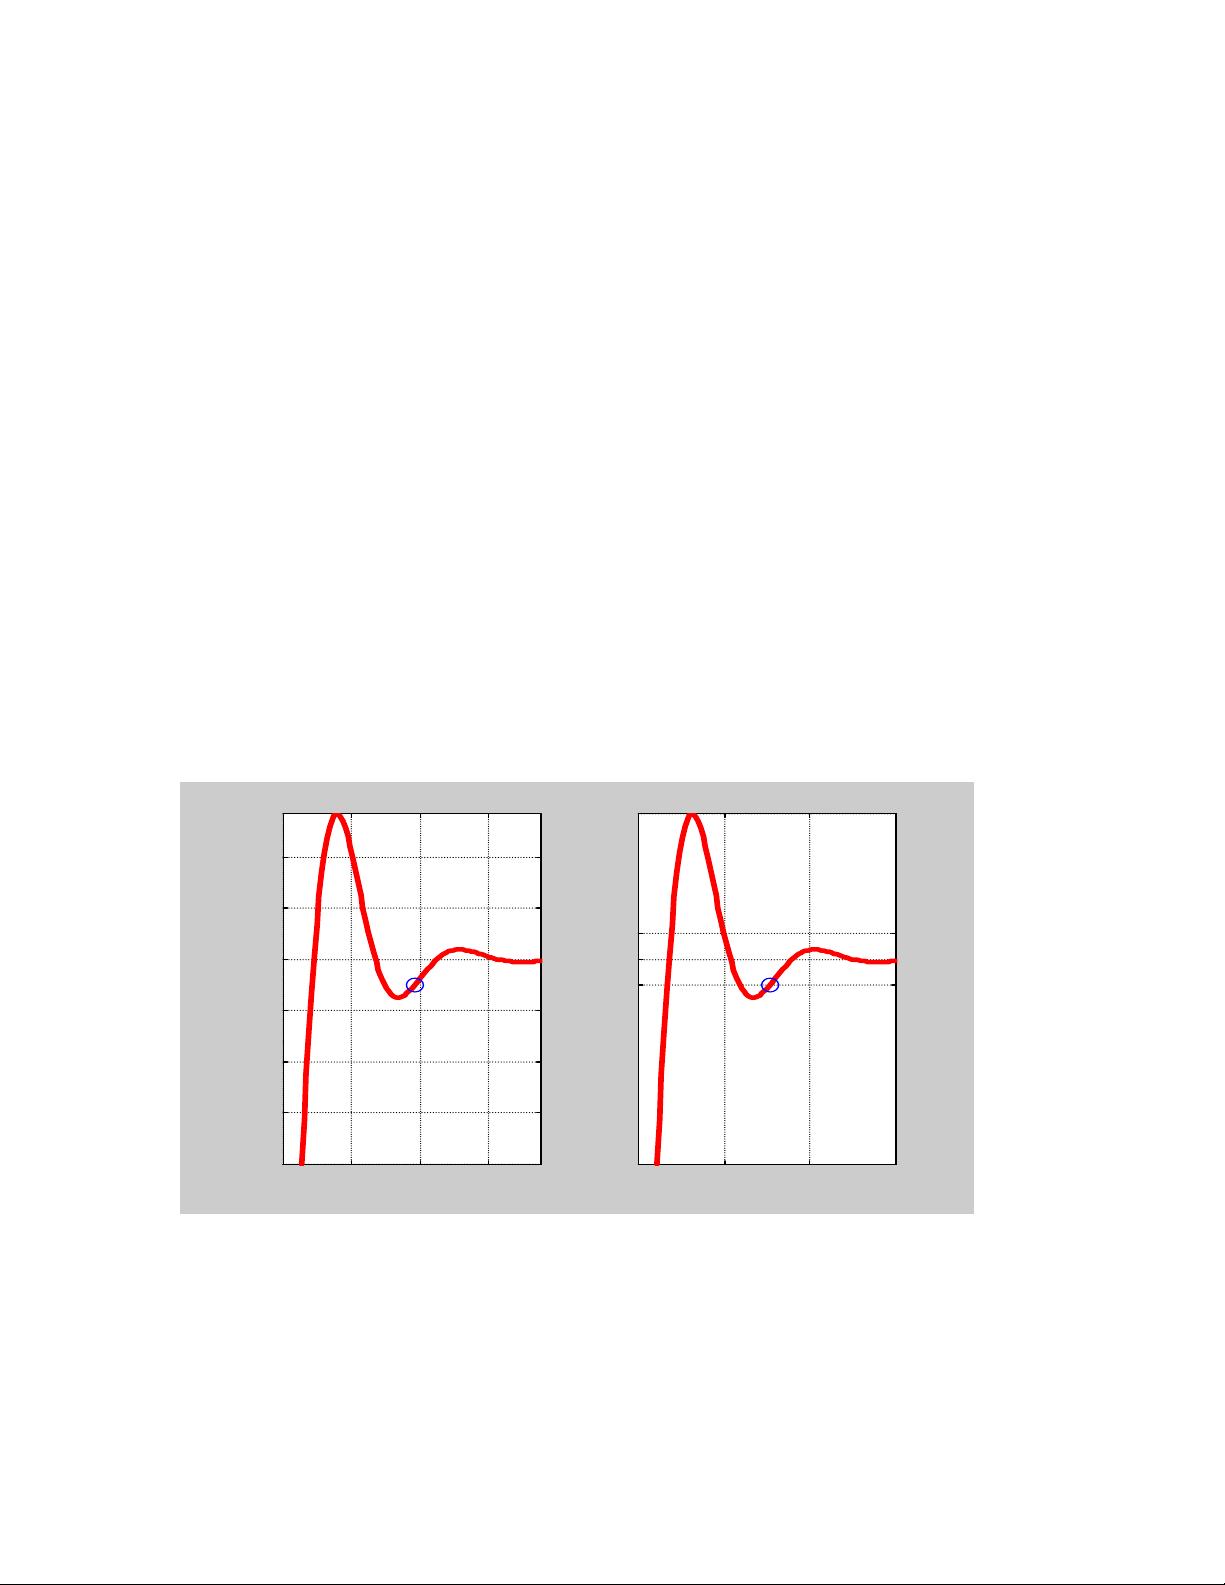
【*例 7.2.3.2-1】通过绘制二阶系统阶跃响应,演示 MATLAB 新旧版指令在标识
图形上的差别。本例比较综合,涉及的指令知识较广。假如读者能耐心读一下指
令、实践操作一遍、再看一下例后的说明,定会有匪浅的收益。
clf;t=6*pi*(0:100)/100;y=1-exp(-0.3*t).*cos(0.7*t);
tt=t(find(abs(y-1)>0.05));ts=max(tt);
%<2>
subplot(1,2,1),plot(t,y,'r-','LineWidth',3),grid on
%<3>
axis([0,6*pi,0.6,max(y)])
%<4>
title('y=1–exp(-alpha*t)*cos(omega*t)')
%<5>
text(11,1.25,'alpha=0.3');text(11,1.15,'omega=0.7')
hold on;plot(ts,0.95,'bo','MarkerSize',10);hold off
%<7>
text(ts+1.5,0.95,['ts=' num2str(ts)])
xlabel('t -->'),ylabel('y -->')
%<9>
-2 0 2
-4
-2
0
2
4
Normal and Grid on
-2 0 2
-2
0
2
Equal
-2 0 2
-4
-2
0
2
4
Square
-1 0 1
-2
0
2
Image and Box off
-1 0 1
-1
-0.5
0
0.5
1
Image and Fill
-1 0 1
-2
0
2
Tight
剩余53页未读,继续阅读
2018-09-01 上传
2013-02-27 上传
140 浏览量
2021-09-07 上传
2012-06-13 上传
2021-09-10 上传
2012-06-11 上传

omyligaga
- 粉丝: 97
- 资源: 2万+
 我的内容管理
展开
我的内容管理
展开


最新资源
- Elasticsearch核心改进:实现Translog与索引线程分离
- 分享个人Vim与Git配置文件管理经验
- 文本动画新体验:textillate插件功能介绍
- Python图像处理库Pillow 2.5.2版本发布
- DeepClassifier:简化文本分类任务的深度学习库
- Java领域恩舒技术深度解析
- 渲染jquery-mentions的markdown-it-jquery-mention插件
- CompbuildREDUX:探索Minecraft的现实主义纹理包
- Nest框架的入门教程与部署指南
- Slack黑暗主题脚本教程:简易安装指南
- JavaScript开发进阶:探索develop-it-master项目
- SafeStbImageSharp:提升安全性与代码重构的图像处理库
- Python图像处理库Pillow 2.5.0版本发布
- mytest仓库功能测试与HTML实践
- MATLAB与Python对比分析——cw-09-jareod源代码探究
- KeyGenerator工具:自动化部署节点密钥生成
