数据驱动世界:Gould/Ryan《统计学入门》第二版探索
需积分: 10 57 浏览量
更新于2024-07-17
收藏 19.23MB PDF 举报
"《Essential Statistics: Exploring the World through Data》第二版是由Ryan Goulde撰写的一本统计学教材,专为一学期的入门统计课程设计。本书在数据驱动的世界背景下,旨在教会学生批判性地理解和分析数据,培养他们的“数据思维习惯”。无论学生的数学背景如何,都能通过清晰、不具威胁性的写作风格和精心设计的教学方法,学习如何思考数据以及如何用数据进行推理。
该书共分为10章,涵盖了数据分析的基础知识。第一章介绍数据,引导学生进入统计的世界;第二章通过图形展示变异;第三章则深入探讨数值总结,包括中心和变异的测量;第四章介绍了回归分析,用于探索变量之间的关联;第五章讨论了概率模型在刻画变异中的作用;第六章进一步研究了正态和二项分布模型,以及随机事件的模拟;第七章涉及抽样调查和推断,第八章和第九章分别讲解了人口比例和均值的假设检验;第十章关注分类变量的分析与研究解释。附录提供了表格、技术问题答案、练习题答案以及信用信息等实用工具。
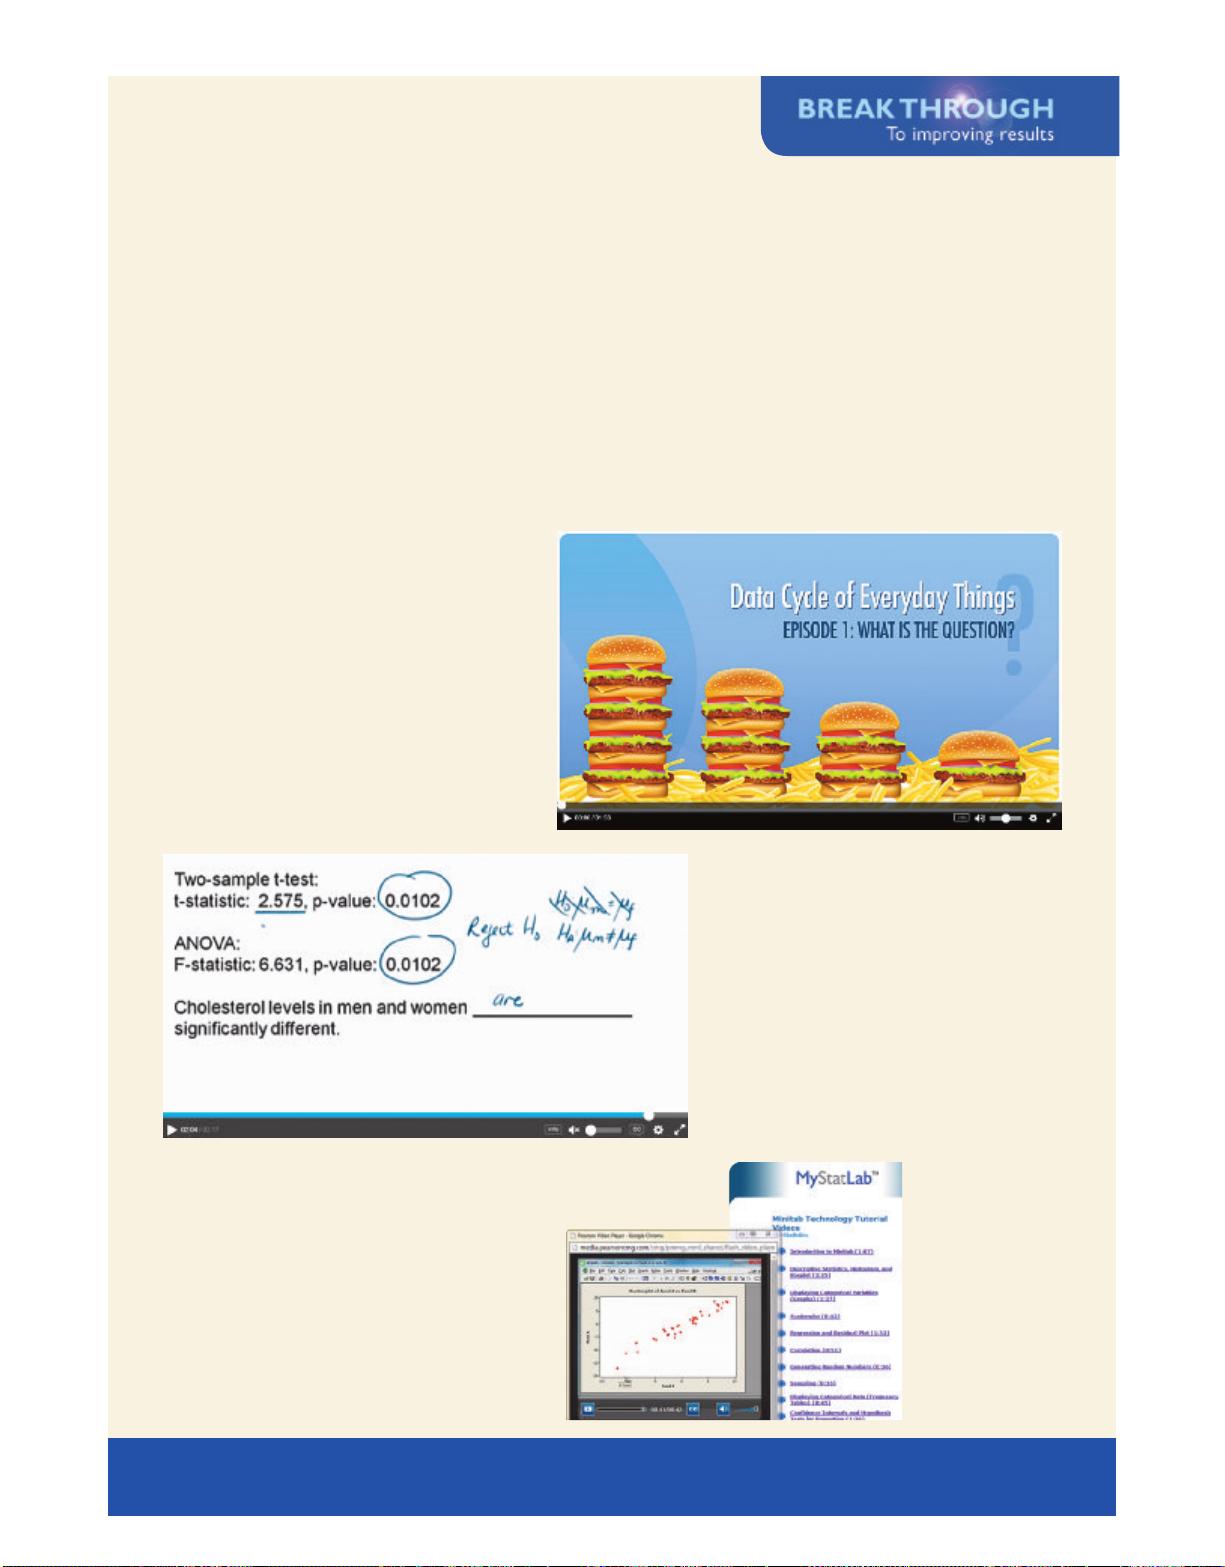
MyStatLab是一个强大的在线资源平台,整合了StatCrunch软件,使学生能够方便地处理练习题中的数据。StatCrunch还提供了一系列视频资源——StatTalk,由统计学家Andrew Vickers主持,通过有趣的故事和实际案例来教授统计概念,并与课程内容无缝集成。此外,该平台还支持移动设备上的互动实验和应用程序,让学生在日常生活中将统计学知识付诸实践。
《Essential Statistics: Exploring the World through Data》第二版是一本实用且全面的教材,不仅教授统计理论,还注重培养学生的数据处理和批判性思维能力,帮助他们在日常生活和职业生涯中运用统计知识。"

PREFACE 15
Looking Back reminders refer students to earlier coverage of a topic.
Details clarify or expand on a concept.
•
KEY
POINT
Key Points highlight essential concepts to draw special attention to them.
Understanding these concepts is essential for progress.
• Snapshots break down key statistical concepts introduced in the chapter,
quickly summarizing each concept or procedure and indicating when and how
it should be used.
• An abundance of worked-out examples model solutions to real-world problems rel-
evant to students’ lives. Each example is tied to an end-of-chapter exercise so that
students can practice solving a similar problem and test their understanding. Within the
exercise sets, the icon TRY indicates which problems are tied to worked-out examples
in that chapter, and the numbers of those examples are indicated.
• The Chapter Review that concludes each chapter provides a list of important new
terms, student learning objectives, a summary of the concepts and methods dis-
cussed, and sources for data, articles, and graphics referred to in the chapter.
Active Learning
• For each chapter we’ve included an activity, Exploring Statistics, that students
are intended to do in class as a group. We have used these activities ourselves, and
we have found that they greatly increase student understanding and keep students
engaged in class.
• All exercises are located at the end of the chapter. Section Exercises are designed
to begin with a few basic problems that strengthen recall and assess basic knowl-
edge, followed by mid-level exercises that ask more complex, open-ended ques-
tions. Chapter Review Exercises provide a comprehensive review of material
covered throughout the chapter.
The exercises emphasize good statistical practice by requiring students to
verify conditions, make suitable use of graphics, find numerical values, and
interpret their findings in writing. All exercises are paired so that students can check
their work on the odd-numbered exercise and then tackle the corresponding even-
numbered exercise. The answers to all odd-numbered exercises appear in the back
of the text.
Challenging exercises, identified with an asterisk (*), ask open-ended questions
and sometimes require students to perform a complete statistical analysis. For
exercises marked with a , accompanying data sets are available in MyStatLab and
on the companion website.
• Most chapters include select exercises marked with a within the exercise set,
to indicate that problem-solving help is available in the Guided Exercises
section. If students need support while doing homework, they can turn to the
Guided Exercises to see a step-by-step approach to solving the problem.
Acknowledgments
We are grateful for the attention and energy that a large number of people devoted to
making this a better book. We extend our gratitude to Elaine Newman (Sonoma State
University) and Ann Cannon (Cornell College), who checked the accuracy of this
text and its many exercises. Thanks also to David Chelton, our developmental editor,
to Carol Merrigan, who handled production, to Peggy McMahon, project manager,
and to Connie Day, our copyeditor. Many thanks to John Norbutas for his technical
advice and help with the TechTips. We thank Suzanna Bainbridge, our acquisitions
A01_GOUL1228_02_GE_FM.indd 15 07/09/16 2:48 pm


剩余585页未读,继续阅读
2015-01-04 上传
2018-04-11 上传
2021-09-30 上传
2016-11-19 上传
2019-06-16 上传
2019-04-21 上传
2010-06-12 上传
2019-09-18 上传
2017-02-08 上传

THESUMMERE
- 粉丝: 23
- 资源: 328
 我的内容管理
展开
我的内容管理
展开


最新资源
- 前端协作项目:发布猜图游戏功能与待修复事项
- Spring框架REST服务开发实践指南
- ALU课设实现基础与高级运算功能
- 深入了解STK:C++音频信号处理综合工具套件
- 华中科技大学电信学院软件无线电实验资料汇总
- CGSN数据解析与集成验证工具集:Python和Shell脚本
- Java实现的远程视频会议系统开发教程
- Change-OEM: 用Java修改Windows OEM信息与Logo
- cmnd:文本到远程API的桥接平台开发
- 解决BIOS刷写错误28:PRR.exe的应用与效果
- 深度学习对抗攻击库:adversarial_robustness_toolbox 1.10.0
- Win7系统CP2102驱动下载与安装指南
- 深入理解Java中的函数式编程技巧
- GY-906 MLX90614ESF传感器模块温度采集应用资料
- Adversarial Robustness Toolbox 1.15.1 工具包安装教程
- GNU Radio的供应商中立SDR开发包:gr-sdr介绍
