
Phase-phase coupling. Oscillations with frequencies f
n
and f
m
¼
m
n
f
n
; n;
m 2 ℕ are called n:m phase-coupled if jmΦ
n
ðtÞnΦ
m
ðtÞj < const , where
Φ
n
ðtÞ and Φ
m
ðtÞ define the instantaneous phases of the two oscillations at
f
n
and f
m
respectively. To quantify n : m phase-phase coupling, phase-
locking value (PLV) is widely used (Palva et al., 2005; Sauseng et al.,
2008; Scheffer-Teixeira and Tort, 2016; Siebenhühner et al., 2016) and it
is defined as
< e
jΨ
n;m
ðtÞ
>
, where Ψ
n;m
ðtÞ¼ðmΦ
n
ðtÞnΦ
m
ðtÞÞ, <:>
stands for computation of the mean over time samples, j is the imaginary
number, and j:j is the absolute value operator.
Amplitude-amplitude coupling. In the case of amplitude-amplitude
coupling, the instantaneous amplitudes of oscillations are correlated.
Therefore, the correlation coefficient of the oscillations’ envelopes in-
dicates the strength of the amplitude-amplitude coupling.
3.3. Detection of cross-frequency coupling: problem formulation
We assume that there are N non-linearly coupled pairs of source
signals
fð
s
ðnÞ
i
; s
ðmÞ
i
Þg
N
i¼1
at frequencies f
n
and f
m
, where f
n
¼ nf
b
and f
m
¼
mf
b
. f
b
is a base-frequency relating f
n
and f
m
to each other. In the rest of
the paper, all the criteria and equations mentioned for frequency f
n
holds
for frequency f
m
as well. s
ðnÞ
i
2 R
1T
is a narrow-band source signal at f
n
,
where T is the number of time samples. The electrical (or magnetic) ac-
tivity measured at the sensors can be modeled as a linear mixture of the
sources as in the following (Baillet et al., 2001; Haufe et al., 2014):
x ¼ P
ðnÞ
S
ðnÞ
þ P
ðmÞ
S
ðmÞ
þ ξ (1)
where X 2 R
CT
is the matrix of multi-channel measured signal with C as
the number of channels. P
ðnÞ
¼½
p
ðnÞ
1
; ⋯; p
ðnÞ
N
. We call p
ðnÞ
i
2 R
C1
the
mixing pattern of source s
ðnÞ
i
. Additionally, S
ðnÞ
¼
½
s
ðnÞ
1
; ⋯; s
ðnÞ
N
2 R
NT
is
the matrix of source signals at f
n
, which are CF coupled to sources in
matrix S
ðmÞ
¼½
s
ðmÞ
1
; ⋯; s
ðmÞ
N
. In equation (1), ξ denotes the noise signal,
which cannot be explained by the linear model. Note that the superscript
of the variables is an indication of their frequency, e.g the superscript ðnÞ
in s
ðnÞ
i
is related to the subscript n of f
n
. As mentioned in section 3.2, the
coupling is called n : m coupling if ðs
ðnÞ
i
; s
ðmÞ
i
Þ are phase-phase coupled.
However, we use this notation for amplitude-amplitude coupling as well
so that we can denote the frequency ratios easier.
We provide an example here. Assume that we have two coupled
source signals in
α
and β frequency band, i.e. N ¼ 2, n ¼ 1; m ¼ 2, and
f
b
¼ 10 Hz; f
1
¼ 10 Hz; f
2
¼ 20 Hz. Then S
ð1Þ
¼
s
ð1Þ
1
; s
ð1Þ
2
and S
ð2Þ
¼
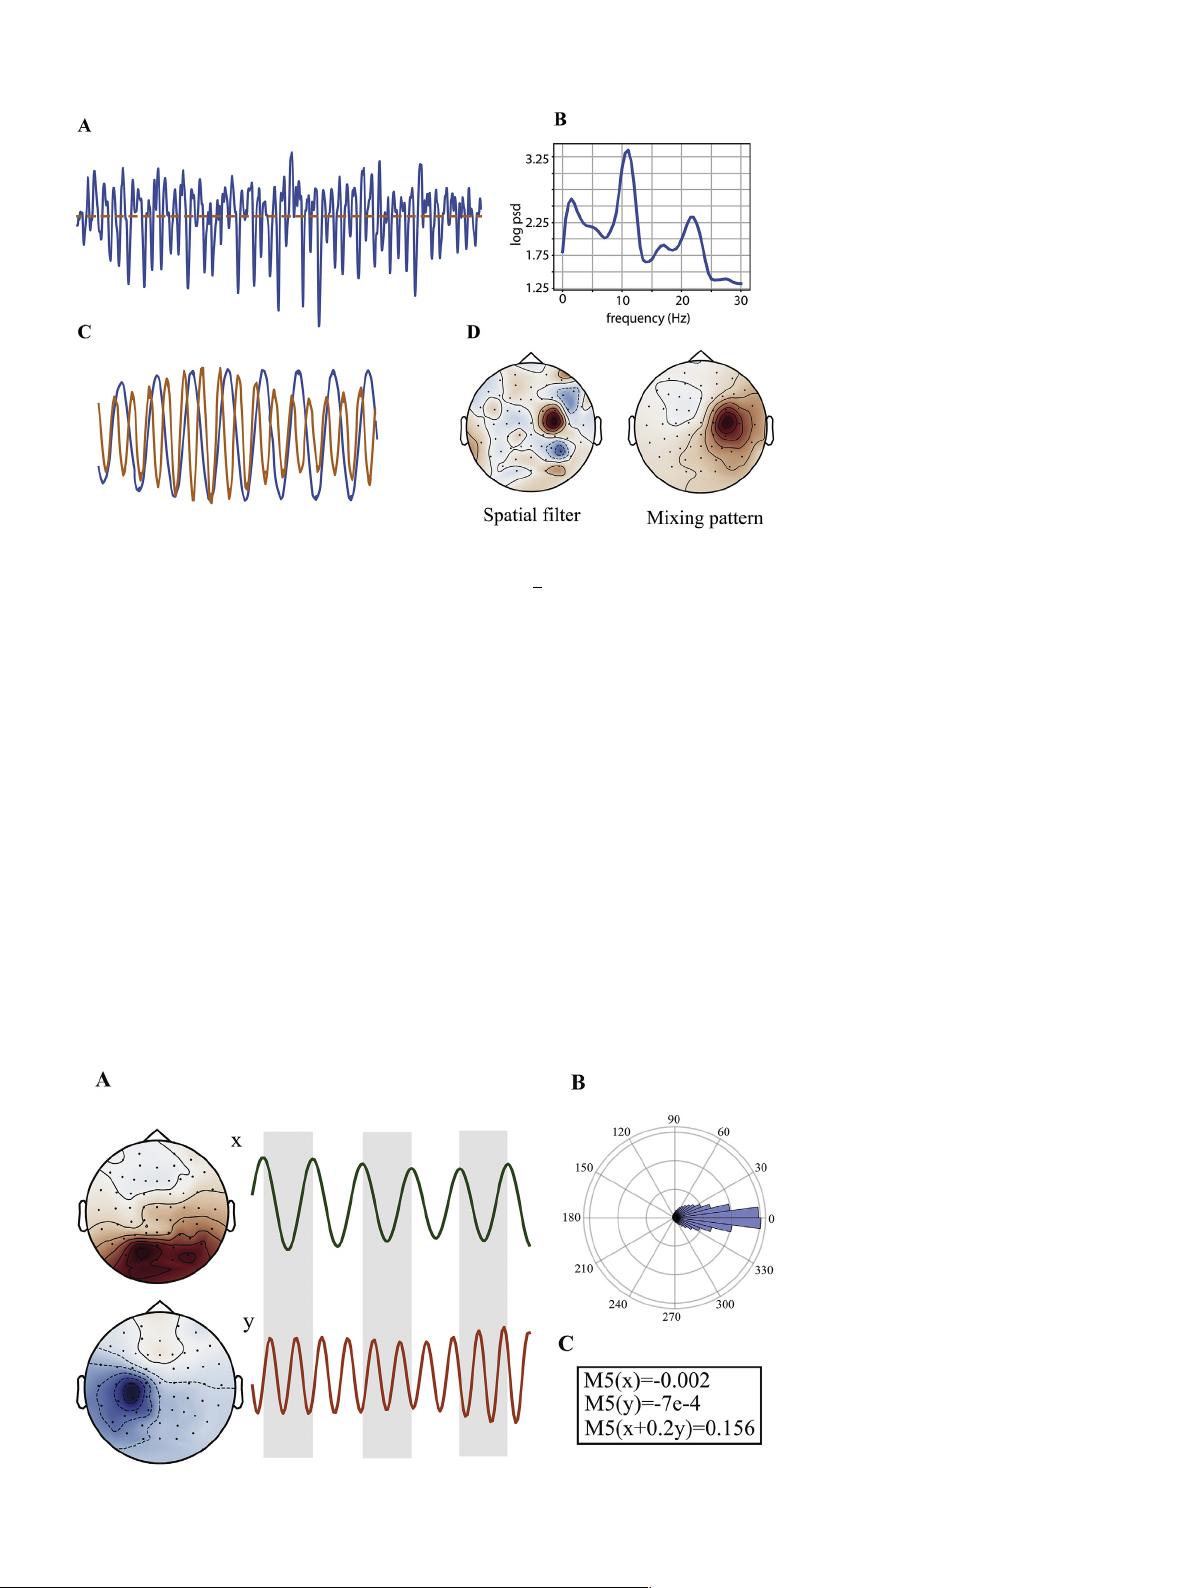
Fig. 1. A non-sinusoidal oscillation obtained from
spatial filtering of EEG of a subject of LEMON
dataset (Babayan et al., 2019) with the spatial filter
in panel D. Panel (A) shows a segment of the time
series of the oscillation with a power spectral
density (PSD) shown in panel (B). The PSD of the
oscillation has clear peaks in alpha and beta bands.
Panel (C) shows a segment of the narrow-band
components (alpha and beta) of the oscillation in
(A). The two components are phase-coupled. Panel
(D) depicts the spatial filter and mixing pattern
(Haufe et al., 2014) of the oscillation, computed
with NID.
Fig. 2. Two phase coupled sources in alpha (x) and
beta (y) band extracted with NID using real EEG
data of a subject from LEMON dataset (Babayan
et al., 2019). Panel (A) shows a segment of alpha
and beta oscillations and their spatial patterns.
Panel (B) depicts the histogram of 2Φ
x
Φ
y
, where
Φ stands for the phase of a signal. The fact that the
phase difference is located in a small sector of the
phase diagram indicates a strong coupling between
alpha (x) and beta (y) oscillations. Panel (C) shows
the value of the fifth moment (denoted as M5) of
the narrow-band signals in panel (A) and their
linear mixture, indicating more non-Gaussianity for
the mixture than for the constituent oscillations.
Note that the fifth moment is used as a measure of
non-Gaussianity in NID’s algorithm.
M.J. Idaji et al. NeuroImage 211 (2020) 116599
3
剩余13页未读,继续阅读

2401_83389103
- 粉丝: 0
- 资源: 1
 我的内容管理
展开
我的内容管理
展开


最新资源
- C++标准程序库:权威指南
- Java解惑:奇数判断误区与改进方法
- C++编程必读:20种设计模式详解与实战
- LM3S8962微控制器数据手册
- 51单片机C语言实战教程:从入门到精通
- Spring3.0权威指南:JavaEE6实战
- Win32多线程程序设计详解
- Lucene2.9.1开发全攻略:从环境配置到索引创建
- 内存虚拟硬盘技术:提升电脑速度的秘密武器
- Java操作数据库:保存与显示图片到数据库及页面
- ISO14001:2004环境管理体系要求详解
- ShopExV4.8二次开发详解
- 企业形象与产品推广一站式网站建设技术方案揭秘
- Shopex二次开发:触发器与控制器重定向技术详解
- FPGA开发实战指南:创新设计与进阶技巧
- ShopExV4.8二次开发入门:解决升级问题与功能扩展
资源上传下载、课程学习等过程中有任何疑问或建议,欢迎提出宝贵意见哦~我们会及时处理!
点击此处反馈


