200 W. Zhang et al. / Microprocessors and Microsystems 47 (2016) 198–208
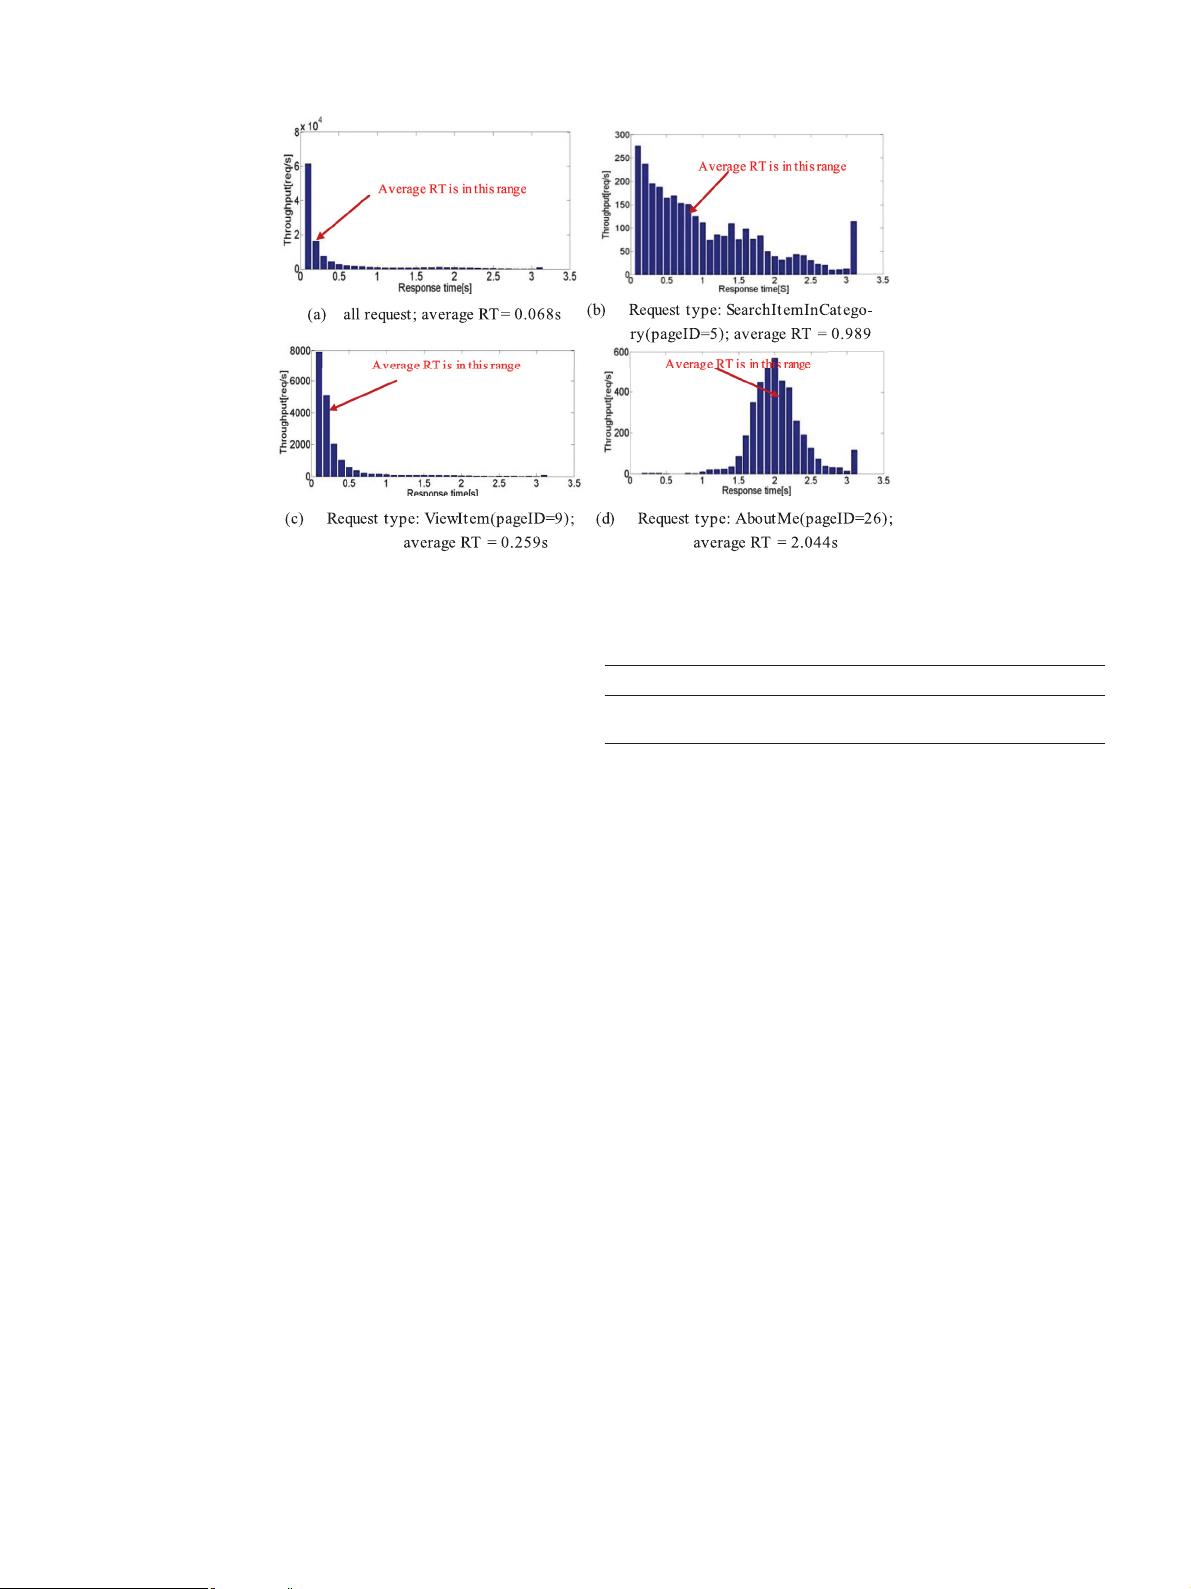
Fig. 2. End-to-end response time distribution of the system in workload 140 0; the average CPU utilization of the bottleneck server is 90% in 10 minutes runtime experiments.
Fig 3 (b) and 3(c) show the average system response time
and throughput aggregated at 100 ms and 10 s time granularities
respectively. Fig 3 (b) shows both the system response time and
throughput present large fluctuation while such fluctuations are
highly blurred when 10 second (10 second or even longer control
interval is frequently used in automatic self-scaling systems [17,
18, 19, 20] ) time granularity is used ( Fig 3 (c)). The standard
deviations of throughput and response time in Fig 3 (b) are 10.46
and 194.08 respectively, at the same time the standard deviations
of them are 19.52 and 297.35 respectively in Fig 3 (c).
(2) Fine-Grained CPU Utilization Analysis: we analysis the CPU
utilization of each tier through fine-grained analysis. The
system CPU utilization may be low at a coarse time gran-
ularity, it fluctuates significantly if observed at a finer time
granularity. And we find the CPU utilization of DB tier is the
highest among these three tiers.
Fig 3 (d) shows the CPU utilization of every tie. In this result we
see that the CPU utilization of web-tier or app-tier is about 40%
and the maximum is not to 80% while such utilization of DB-tie is
about 80% and most of them have to 90%, even some has reached
to 100%. From Fig 3 (d) we can see that the MySQL CPU frequently
reaches 90% even 100% utilization if monitored at 1 s granularity
while such CPU saturation disappears if 10 s time granularity is
used in Fig 3 (e).
At the workload of 140 0 users, through fine-grained analysis we
find DB-tier is bottleneck tier, and we do deep analysis of tracing
requests to find the reason that causes large response time fluctu-
ations in section 3.2 .
3.2. Finding causes through tracing requests
In this section, we introduce our approach to logging, then di-
agnosing anomalous categories based on collected request data,
and identifying cause of large response time fluctuation eventually.
(1) Tracing Request Data : We do some modification on RUBiS
source program that we add a class. This class is mainly
responsible for collecting request data when a sampled re-
quest sent by client.
Table 1
Tracing log formats and examples.
UserSessionID PageID VistCount StartTime EndTime ResonseTime
UserSession274 15 4 31 :31.7 31 :32.0 301
UserSession300 5 3 31 :31.8 31 :31.8 59
The data structure of a tracing log is shown in Table 1 , which
contains six items. UserSessionID indicates the client who send re-
quest. PageID indicate the page which client visit. VistCount record
the times of this page is visited by this client from it enters the
system to leave, this filed will automatic add 1 when this page is
visited. StartTime records the time of the request is sent. EndTime
record the time of the request is responded. ResonseTime record the
request processing time.
UserSessionID should be unique for every client. A session is a
sequence of interactions for the same customer. For each customer
session, the client emulator opens a persistent HTTP connection to
the Web server and closes it at the end of the session. A client is
only one UserSessionID , but one client can send more than one re-
quests. There are 27 kinds of request in RUBiS, and one page refers
to one request, PageID is from 0 to 26. Different number of pageID
represents the different request.
(2) Clustering Request Data to Diagnose Anomalous Categories: Af-
ter collect all data as described in Section 3.1 , we cluster
such data base on request-oriented way. The request with
the same PageID will be clustered into one category.
Definition 1. Request: for each query submitted to the DBMS we
assume it belongs to a specific query type Q
K
, where 1 ≤K ≤M and
M is the total number of query types. A request comprises zero or
more instances of each query type.
Definition 2. Request Type: the requests that are composed of the
same query type belong to one request type. In our experiment the
requests that own the same pageID belong to one request type.
Definition 3. Request Category: Let C be a set of request cate-
gories, a category C
j
is defined as a vector < T
Ij,
,…,T
Nj
> , where T
ij
denotes the response time of the ith request when sorting the re-
quest order by StartTime of the request type j, and 0 ≤ j ≤ 26.


