2. Causal Profiling Overview
This section describes the major steps in collecting, process-
ing, and interpreting a causal profile with C
OZ
, our prototype
causal profiler.
Profiler startup. A user invokes C
OZ using a command of
the form
coz run --- <program> <args>
. At the
beginning of the program’s execution, C
OZ
collects debug
information for the executable and all loaded libraries. Users
may specify file and binary scope, which restricts C
OZ
’s
experiments to speedups in the specified files. By default,
COZ will consider speedups in any source file from the main
executable. C
OZ
builds a map from instructions to source
lines using the program’s debug information and the specified
scope. Once the source map is constructed, C
OZ
creates a
profiler thread and resumes normal execution.
Experiment initialization.
C
OZ
’s profiler thread begins an
experiment by selecting a line to virtually speed up, and a
randomly-chosen percent speedup. Both parameters must be
selected randomly; any systematic method of exploring lines
or speedups could lead to systematic bias in profile results.
One might assume that C
OZ
could exclude lines or virtual
speedup amounts that have not shown a performance effect
early in previous experiments, but prioritizing experiments
based on past results would prevent C
OZ
from identifying
an important line if its performance only matters after some
warmup period. Once a line and speedup have been selected,
the profiler thread saves the number of visits to each progress
point and begins the experiment.
Applying a virtual speedup.
Every time the profiled pro-
gram creates a thread, C
OZ
begins sampling the instruction
pointer from this thread. COZ processes samples within each
thread to implement a sampling version of virtual speedups.
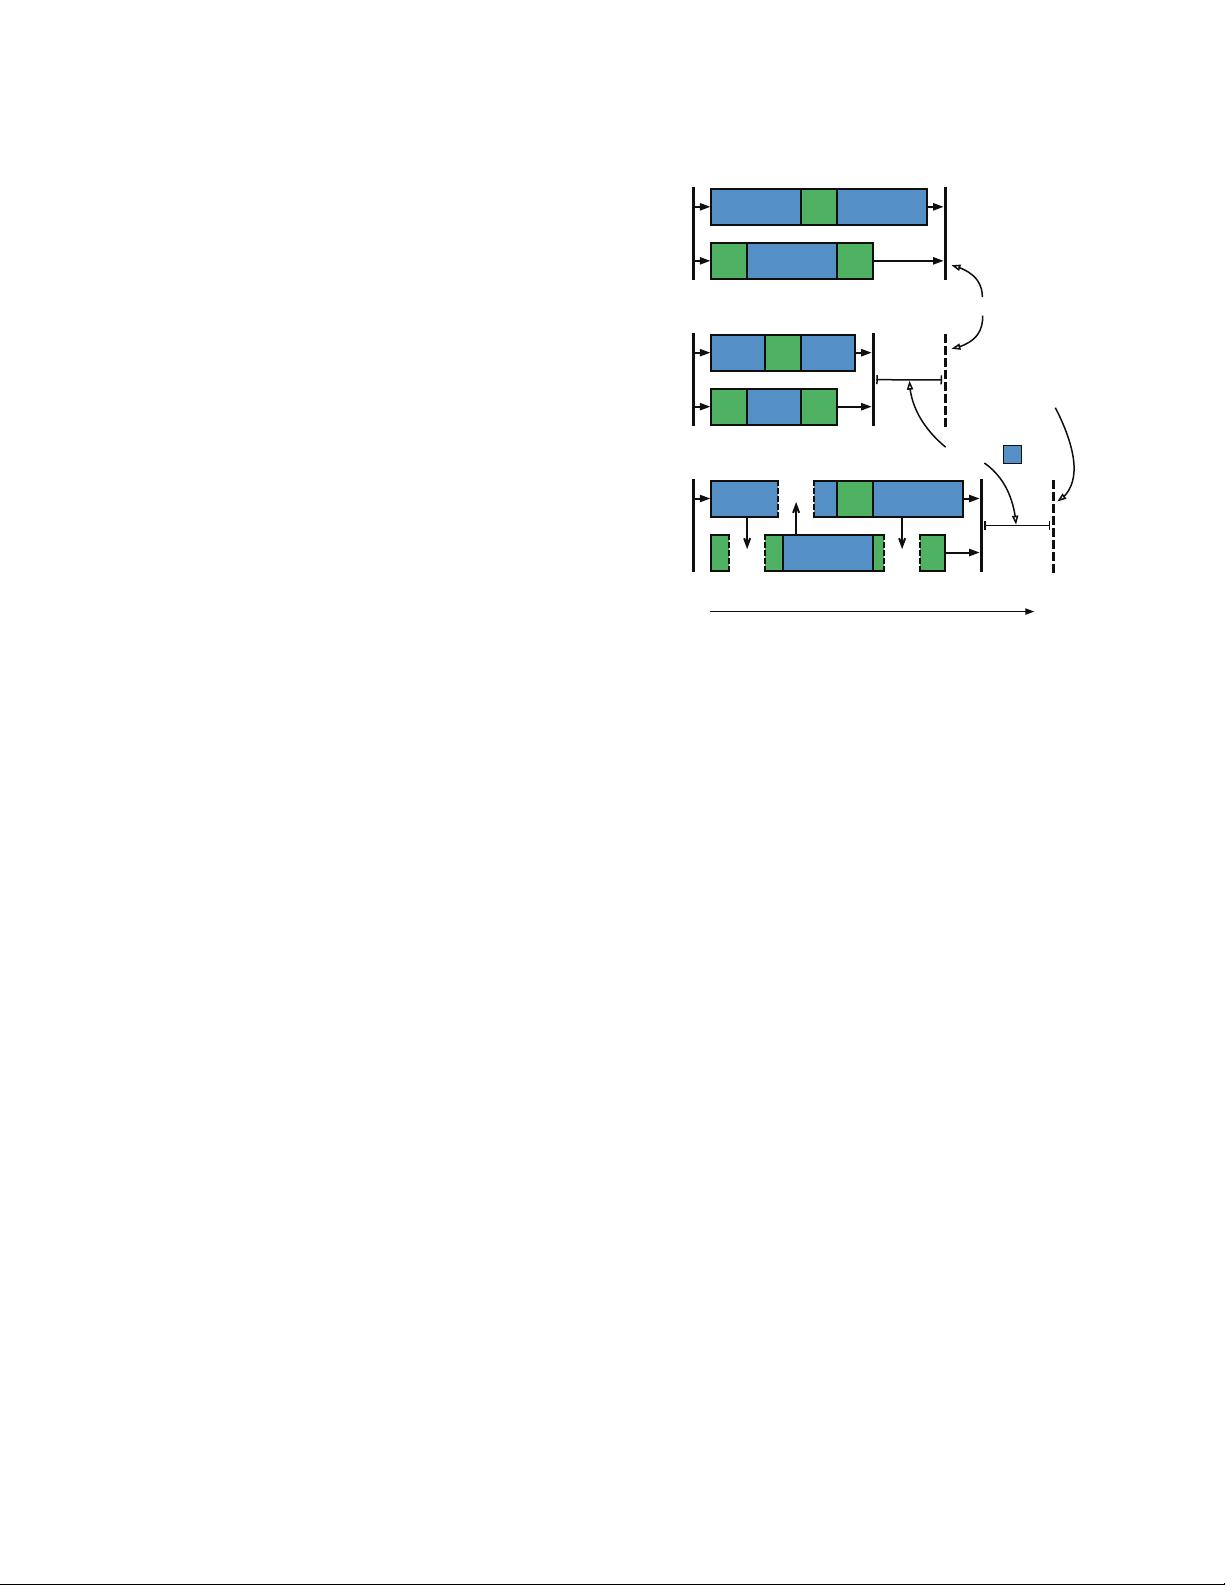
In Section 3.4, we show the equivalence between the virtual
speedup mechanism shown in Figure 3 and the sampling
approach used by C
OZ
. Every time a sample is available, a
thread checks whether the sample falls in the line of code
selected for virtual speedup. If so, it forces other threads to
pause. This process continues until the profiler thread indi-
cates that the experiment has completed.
Ending an experiment.
C
OZ
ends the experiment after a
pre-determined time has elapsed. If there were too few visits
to progress points during the experiment—five is the default
minimum—C
OZ
doubles the experiment time for the rest
of the execution. Once the experiment has completed, the
profiler thread logs the results of the experiment, including
the effective duration of the experiment (runtime minus the
total inserted delay), the selected line and speedup, and the
number of visits to all progress points. Before beginning the
next experiment, COZ will pause for a brief cooloff period to
allow any remaining samples to be processed before the next
experiment begins.
Illustration of Virtual Speedup
f
g
t2
t1
t2
t1
t2
t1
f
f
f
g
g
g
f
f
fg
gg
f
f
g
g
g
f
(a) Original Program
(b) Actual Speedup
(c) Virtual Speedup
original runtime
+
n
f
· d
original runtime
…
g
…
…
effect of optimizing by d
f
Figure 3:
An illustration of virtual speedup: (a) shows the original
execution of two threads running functions
f
and
g
; (b) shows the
effect of a actually speeding up
f
by 40%; (c) shows the effect of
virtually speeding up
f
by 40%. Each time
f
runs in one thread, all
other threads pause for 40% of
f
’s original execution time (shown as
ellipsis). The difference between the runtime in (c) and the original
runtime plus
n
f
· d
—the number of times
f
ran times the delay
size—is the same as the effect of actually optimizing f.
Producing a causal profile.
After an application has been
profiled with C
OZ
, the results of all the performance exper-
iments can be combined to produce a causal profile. Each
experiment has two independent variables: the line chosen
for virtual speedup and the amount of virtual speedup. C
OZ
records the dependent variable, the rate of visits to each
progress point, in two numbers: the total number of visits
to each progress point and the effective duration of the exper-
iment (the real runtime minus the total length of all pauses).
Experiments with the same independent variables can be
combined by adding the progress point visits and experiment
durations.
Once experiments have been combined, C
OZ
groups ex-
periments by the line that was virtually sped up. Any lines
that do not have a measurement of 0% virtual speedup are
discarded; without this baseline measurement we cannot com-
pute a percent speedup relative to the original program. Mea-
suring this baseline separately for each line guarantees that
any line-dependent overhead from virtual speedups, such as
the additional cross-thread communication required to insert
delays when a frequently-executed line runs, will not skew
profile results. By default, C
OZ
will also discard any lines
with fewer than 5 different virtual speedup amounts (a plot
that only shows the effect of a 75% virtual speedup is not
particularly useful). Finally, we compute the percent program


