"MATLAB三维散点图:线、曲面和网格"
需积分: 0 165 浏览量
更新于2024-01-30
收藏 2.38MB PDF 举报
Three-dimensional (3-D) plots can be a useful way to present data that consists of more than two variables. MATLAB provides various options for displaying three-dimensional data, including line and wire, surface, mesh plots, and many others. These plots can also be formatted to have a specific appearance and special effects. The chapter on three-dimensional plots serves as a continuation of the material introduced in Chapter 5, where two-dimensional plots are discussed. Since not all MATLAB users utilize three-dimensional plots, they are presented in a separate chapter. Additionally, new MATLAB users may find it easier to practice two-dimensional plots and learn the material in Chapters 6-9 before attempting three-dimensional plots. The assumption is that readers are familiar with two-dimensional plotting in the remaining sections of this chapter.
The link to the resource about three-dimensional plots is provided for additional information and guidance. The chapter covers various aspects of three-dimensional plotting and the different options available in MATLAB for displaying and formatting 3-D plots. It is a continuation of the material introduced in earlier chapters, and it assumes readers are already familiar with two-dimensional plotting.
In conclusion, the chapter on three-dimensional plots in MATLAB provides a comprehensive overview of the various options and features available for displaying and formatting 3-D data. It serves as a continuation of the material in previous chapters and provides valuable information for users looking to effectively present and visualize data in three dimensions. Additional resources are also provided for further guidance and information.
10.2 Mesh and Surface Plots 327
Once the three matrices have been created, they can be used to plot mesh or sur-
face plots.
Making mesh and surface plots:
A mesh or surface plot is created with the mesh or surf command, which has
the form:
where X and Y are matrices with the coordinates of the grid and Z is a matrix with
the value of
z at the grid points. The mesh plot is made of lines that connect the
points. In the surface plot, areas within the mesh lines are colored.
As an example, the following script file contains a complete program that
creates the grid and then makes a mesh (or surface) plot of the function
over the domain and .
Note that in the program above the vectors x and y have a much smaller spacing
than the spacing earlier in the section. The smaller spacing creates a denser grid.
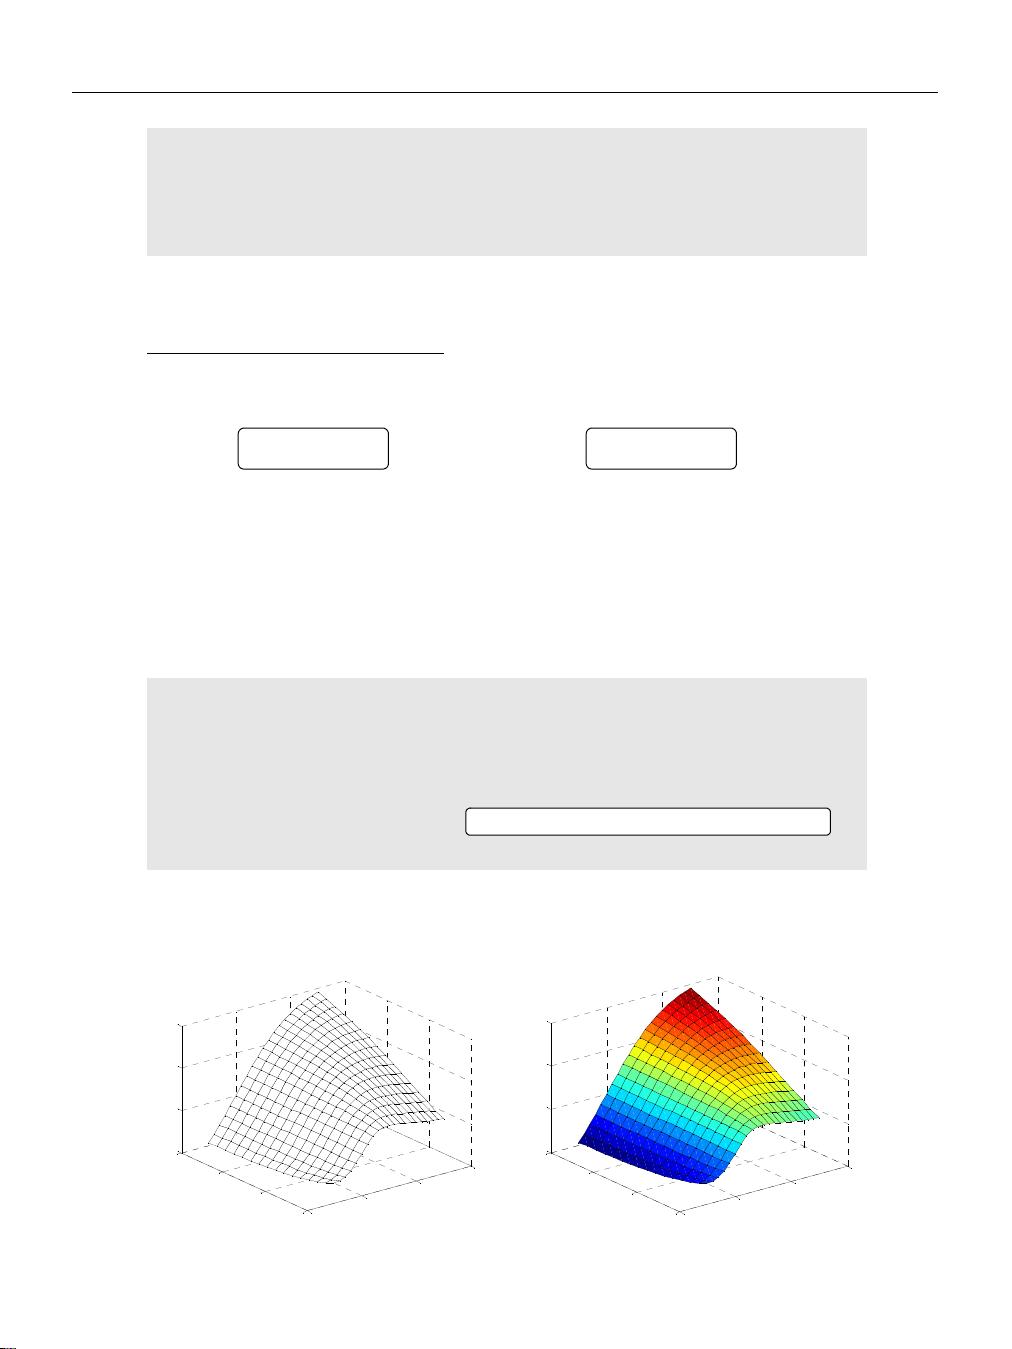
The figures created by the program are:
Z =
-0.5000 0 0.5000 0.4000 0.3000
-0.8000 0 0.8000 1.0000 0.9231
-0.9000 0 0.9000 1.3846 1.5000
-0.9412 0 0.9412 1.6000 1.9200
x=-1:0.1:3;
y=1:0.1:4;
[X,Y]=meshgrid(x,y);
Z=X.*Y.^2./(X.^2+Y.^2);
mesh(X,Y,Z)
xlabel('x'); ylabel('y'); zlabel('z')
mesh(X,Y,Z) surf(X,Y,Z)
z
xy
2
x
2
y
2
+
----------------=
1– x 3≤≤
1 y 4≤≤
Type surf(X,Y,Z) for surface plot.
-2
0
2
4
1
2
3
4
-1
0
1
2
x
y
z
-2
0
2
4
1
2
3
4
-1
0
1
2
x
y
z
Mesh plot
Surface plot
剩余23页未读,继续阅读
2023-03-26 上传
2023-09-03 上传
2023-05-13 上传
2023-09-21 上传
2023-07-28 上传
2024-04-09 上传
2024-11-03 上传

极速learner
- 粉丝: 40
- 资源: 85
 我的内容管理
展开
我的内容管理
展开


最新资源
- 深入浅出:自定义 Grunt 任务的实践指南
- 网络物理突变工具的多点路径规划实现与分析
- multifeed: 实现多作者间的超核心共享与同步技术
- C++商品交易系统实习项目详细要求
- macOS系统Python模块whl包安装教程
- 掌握fullstackJS:构建React框架与快速开发应用
- React-Purify: 实现React组件纯净方法的工具介绍
- deck.js:构建现代HTML演示的JavaScript库
- nunn:现代C++17实现的机器学习库开源项目
- Python安装包 Acquisition-4.12-cp35-cp35m-win_amd64.whl.zip 使用说明
- Amaranthus-tuberculatus基因组分析脚本集
- Ubuntu 12.04下Realtek RTL8821AE驱动的向后移植指南
- 掌握Jest环境下的最新jsdom功能
- CAGI Toolkit:开源Asterisk PBX的AGI应用开发
- MyDropDemo: 体验QGraphicsView的拖放功能
- 远程FPGA平台上的Quartus II17.1 LCD色块闪烁现象解析
