epoch.plot_psd
时间: 2023-09-25 14:09:24 浏览: 133
`epoch.plot_psd` 是 MNE-Python 中的一个函数,用于绘制 Epoch 中的数据的功率谱密度图。它可以帮助我们分析 EEG/MEG 信号的频域特征,比如 alpha、beta、gamma 等频段的能量分布情况。该函数的使用方法如下:
```python
# 导入必要的库
import mne
# 加载数据
raw = mne.io.read_raw_fif('sample_raw.fif', preload=True)
# 创建 Epochs 对象
events = mne.find_events(raw)
epochs = mne.Epochs(raw, events, tmin=-1, tmax=1, baseline=(None, 0), preload=True)
# 绘制功率谱密度图
epochs.plot_psd(fmin=2, fmax=40)
```
其中,`fmin` 和 `fmax` 分别表示绘制的频率范围的下限和上限。该函数会返回一个 `matplotlib` 的 `figure` 对象,可以使用 `plt.show()` 显示。
相关问题
if opt.vis and ii % opt.plot_every == opt.plot_every - 1: ## 可视化 if os.path.exists(opt.debug_file): ipdb.set_trace() fix_fake_imgs = netg(fix_noises) vis.images(fix_fake_imgs.detach().cpu().numpy()[:64] * 0.5 + 0.5, win='fixfake') vis.images(real_img.data.cpu().numpy()[:64] * 0.5 + 0.5, win='real') vis.plot('errord', errord_meter.value()[0]) vis.plot('errorg', errorg_meter.value()[0]) if (epoch + 1) % opt.save_every == 0: # 保存模型、图片 tv.utils.save_image(fix_fake_imgs.data[:64], '%s/%s.png' % (opt.save_path, epoch), normalize=True, value_range=(-1, 1)) t.save(netd.state_dict(), 'checkpoints/netd_%s.pth' % epoch) t.save(netg.state_dict(), 'checkpoints/netg_%s.pth' % epoch) errord_meter.reset() errorg_meter.reset()的含义
这段代码主要是用于可视化和保存模型、图片。如果设置了可视化(opt.vis=True),则在训练过程中每隔opt.plot_every个batch就会将生成器生成的64张固定噪声对应的假图片和真实图片可视化展示出来,同时将判别器的误差和生成器的误差可视化展示出来。如果可视化时出现问题,可以通过设置opt.debug_file来进入debug模式进行调试。如果到达每opt.save_every个epoch,则会保存生成器和判别器的权重参数以及生成的假图片到指定的路径中。其中,errord_meter和errorg_meter分别用于记录判别器和生成器的误差;netd和netg分别是判别器和生成器的网络模型。
class CosineScheduler: def __init__(self, max_update, base_lr=0.01, final_lr=0, warmup_steps=0, warmup_begin_lr=0): self.base_lr_orig = base_lr self.max_update = max_update self.final_lr = final_lr self.warmup_steps = warmup_steps self.warmup_begin_lr = warmup_begin_lr self.max_steps = self.max_update - self.warmup_steps def get_warmup_lr(self, epoch): increase = (self.base_lr_orig - self.warmup_begin_lr) \ * float(epoch) / float(self.warmup_steps) return self.warmup_begin_lr + increase def __call__(self, epoch): if epoch < self.warmup_steps: return self.get_warmup_lr(epoch) if epoch <= self.max_update: self.base_lr = self.final_lr + ( self.base_lr_orig - self.final_lr) * (1 + math.cos( math.pi * (epoch - self.warmup_steps) / self.max_steps)) / 2 return self.base_lr scheduler = CosineScheduler(max_update=20, base_lr=0.3, final_lr=0.01) d2l.plot(torch.arange(num_epochs), [scheduler(t) for t in range(num_epochs)])
这段代码实现了一个余弦学习率调度程序,可以在训练神经网络时调整学习率。它包括一个 CosineScheduler 类和一个调用方法。在调用方法中,根据给定的 epoch 值,如果 epoch 值小于预热步数 warmup_steps,则返回预热学习率,否则返回余弦学习率。余弦学习率的计算是通过余弦函数实现的,其中初始学习率 base_lr 逐渐减小到最终学习率 final_lr,然后再逐渐增加回去。该程序还可以设置预热开始学习率 warmup_begin_lr 和预热步数 warmup_steps,并且可以根据最大迭代次数 max_update 计算出最大步数 max_steps。最后,该程序可以通过调用 plot 方法来可视化学习率的变化情况。
阅读全文
相关推荐
大家在看
遥感在水利中的应用-遥感图像应用基础
遥感在水利中的应用
GD32串口芯片下载程序软件-(包含使用教程)
GD32串口芯片下载程序软件-(包含使用教程)
使用EPPLUS操作Excel
使用Epplus read Excel文件,write Excel文件,从DataGridView导出至Excel。
码垛机器人说明书
对于随机货盘来说,码垛机器人是唯一的选择。尽管如此,机器人装载也面临比较多的问题,如果要以较高的速度进行生产,将更加困难重重。一个处理随机装载的机器人码垛机需要特殊的软件,通过软件,机器人码垛机与生产线的其他部分相连接,这是个巨大的进步。
DX200 使用說明書.pdf
安川機器人DX200系統控制文檔,包含安川机器人操作说明,安裝解說,基础操作,使用和簡易设置说明。
最新推荐
在keras中model.fit_generator()和model.fit()的区别说明
其中,`steps_per_epoch`表示在每个训练轮次中从生成器获取数据的次数,相当于`x_train`的样本数除以`batch_size`,而`validation_steps`则指定了在验证阶段使用生成器的步骤数。如果使用`model.fit_generator()`,`...
图像去雾基于基于Matlab界面的(多方法对比,PSNR,信息熵,GUI界面).rar
MATLAB设计
c语言打字母游戏源码.zip
c语言打字母游戏源码
c语言做的一个任务管理器.zip
c语言做的一个任务管理器
JetBra-2021.1.x-重置.mp4.zip
JetBra-2021.1.x-重置.mp4.zip
易语言例程:用易核心支持库打造功能丰富的IE浏览框
资源摘要信息:"易语言-易核心支持库实现功能完善的IE浏览框"
易语言是一种简单易学的编程语言,主要面向中文用户。它提供了大量的库和组件,使得开发者能够快速开发各种应用程序。在易语言中,通过调用易核心支持库,可以实现功能完善的IE浏览框。IE浏览框,顾名思义,就是能够在一个应用程序窗口内嵌入一个Internet Explorer浏览器控件,从而实现网页浏览的功能。
易核心支持库是易语言中的一个重要组件,它提供了对IE浏览器核心的调用接口,使得开发者能够在易语言环境下使用IE浏览器的功能。通过这种方式,开发者可以创建一个具有完整功能的IE浏览器实例,它不仅能够显示网页,还能够支持各种浏览器操作,如前进、后退、刷新、停止等,并且还能够响应各种事件,如页面加载完成、链接点击等。
在易语言中实现IE浏览框,通常需要以下几个步骤:
1. 引入易核心支持库:首先需要在易语言的开发环境中引入易核心支持库,这样才能在程序中使用库提供的功能。
2. 创建浏览器控件:使用易核心支持库提供的API,创建一个浏览器控件实例。在这个过程中,可以设置控件的初始大小、位置等属性。
3. 加载网页:将浏览器控件与一个网页地址关联起来,即可在控件中加载显示网页内容。
4. 控制浏览器行为:通过易核心支持库提供的接口,可以控制浏览器的行为,如前进、后退、刷新页面等。同时,也可以响应浏览器事件,实现自定义的交互逻辑。
5. 调试和优化:在开发完成后,需要对IE浏览框进行调试,确保其在不同的操作和网页内容下均能够正常工作。对于性能和兼容性的问题需要进行相应的优化处理。
易语言的易核心支持库使得在易语言环境下实现IE浏览框变得非常方便,它极大地降低了开发难度,并且提高了开发效率。由于易语言的易用性,即使是初学者也能够在短时间内学会如何创建和操作IE浏览框,实现网页浏览的功能。
需要注意的是,由于IE浏览器已经逐渐被微软边缘浏览器(Microsoft Edge)所替代,使用IE核心的技术未来可能面临兼容性和安全性的挑战。因此,在实际开发中,开发者应考虑到这一点,并根据需求选择合适的浏览器控件实现技术。
此外,易语言虽然简化了编程过程,但其在功能上可能不如主流的编程语言(如C++, Java等)强大,且社区和技术支持相比其他语言可能较为有限,这些都是在选择易语言作为开发工具时需要考虑的因素。
文件名列表中的“IE类”可能是指包含实现IE浏览框功能的类库或者示例代码。在易语言中,类库是一组封装好的代码模块,其中包含了各种功能的实现。通过在易语言项目中引用这些类库,开发者可以简化开发过程,快速实现特定功能。而示例代码则为开发者提供了具体的实现参考,帮助理解和学习如何使用易核心支持库来创建IE浏览框。
管理建模和仿真的文件
管理Boualem Benatallah引用此版本:布阿利姆·贝纳塔拉。管理建模和仿真。约瑟夫-傅立叶大学-格勒诺布尔第一大学,1996年。法语。NNT:电话:00345357HAL ID:电话:00345357https://theses.hal.science/tel-003453572008年12月9日提交HAL是一个多学科的开放存取档案馆,用于存放和传播科学研究论文,无论它们是否被公开。论文可以来自法国或国外的教学和研究机构,也可以来自公共或私人研究中心。L’archive ouverte pluridisciplinaire
STM32F407ZG引脚功能深度剖析:掌握引脚分布与配置的秘密(全面解读)
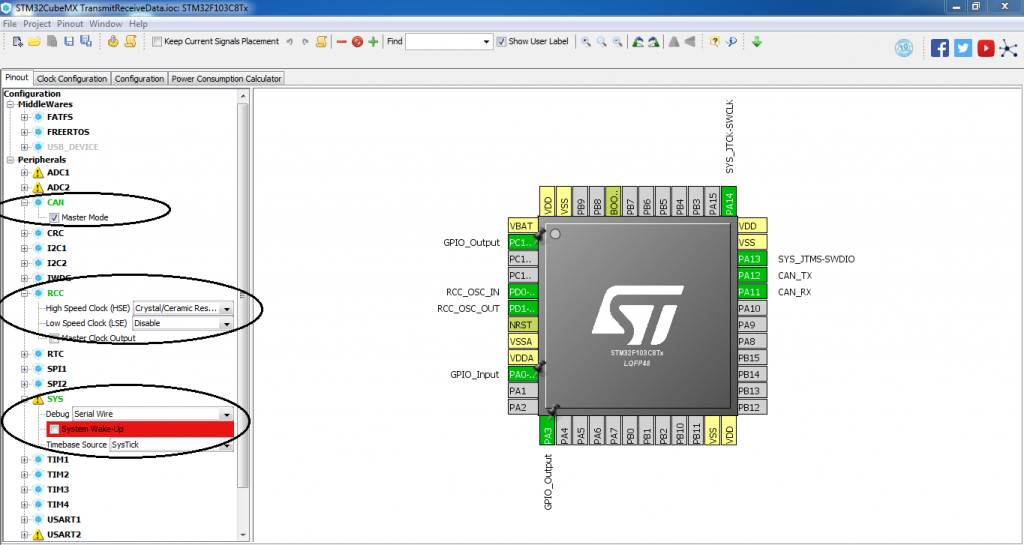
# 摘要
本文全面介绍了STM32F407ZG微控制器的引脚特性、功能、配置和应用。首先概述了该芯片的引脚布局,然后详细探讨了标准外设、高级控制以及特殊功能引脚的不同配置和使用方法。在此基础上,文章深入分析了引脚模式配置、高级配置技巧,并提供了实际应用案例,如LED控制和串口通信。在设计方面,阐述了引脚布局策略、多层板设计及高密度引脚应用的解决方案。最后,介绍
给出文档中问题的答案代码
您提到的是需要编写MATLAB代码来实现文档中的实验任务。以下是根据文档内容编写的MATLAB代码示例:
```matlab
% 上机2 实验代码
% 读取输入图像
inputImage = imread('your_face_image.jpg'); % 替换为您的图像文件路径
if size(inputImage, 1) < 1024 || size(inputImage, 2) < 1024
error('图像尺寸必须大于1024x1024');
end
% 将彩色图像转换为灰度图像
grayImage = rgb2gray(inputImage);
% 调整图像大小为5
Docker构建与运行Next.js应用的指南
资源摘要信息:"rivoltafilippo-next-main"
在探讨“rivoltafilippo-next-main”这一资源时,首先要从标题“rivoltafilippo-next”入手。这个标题可能是某一项目、代码库或应用的命名,结合描述中提到的Docker构建和运行命令,我们可以推断这是一个基于Docker的Node.js应用,特别是使用了Next.js框架的项目。Next.js是一个流行的React框架,用于服务器端渲染和静态网站生成。
描述部分提供了构建和运行基于Docker的Next.js应用的具体命令:
1. `docker build`命令用于创建一个新的Docker镜像。在构建镜像的过程中,开发者可以定义Dockerfile文件,该文件是一个文本文件,包含了创建Docker镜像所需的指令集。通过使用`-t`参数,用户可以为生成的镜像指定一个标签,这里的标签是`my-next-js-app`,意味着构建的镜像将被标记为`my-next-js-app`,方便后续的识别和引用。
2. `docker run`命令则用于运行一个Docker容器,即基于镜像启动一个实例。在这个命令中,`-p 3000:3000`参数指示Docker将容器内的3000端口映射到宿主机的3000端口,这样做通常是为了让宿主机能够访问容器内运行的应用。`my-next-js-app`是容器运行时使用的镜像名称,这个名称应该与构建时指定的标签一致。
最后,我们注意到资源包含了“TypeScript”这一标签,这表明项目可能使用了TypeScript语言。TypeScript是JavaScript的一个超集,它添加了静态类型定义的特性,能够帮助开发者更容易地维护和扩展代码,尤其是在大型项目中。
结合资源名称“rivoltafilippo-next-main”,我们可以推测这是项目的主目录或主仓库。通常情况下,开发者会将项目的源代码、配置文件、构建脚本等放在一个主要的目录中,这个目录通常命名为“main”或“src”等,以便于管理和维护。
综上所述,我们可以总结出以下几个重要的知识点:
- Docker容器和镜像的概念以及它们之间的关系:Docker镜像是静态的只读模板,而Docker容器是从镜像实例化的动态运行环境。
- `docker build`命令的使用方法和作用:这个命令用于创建新的Docker镜像,通常需要一个Dockerfile来指定构建的指令和环境。
- `docker run`命令的使用方法和作用:该命令用于根据镜像启动一个或多个容器实例,并可指定端口映射等运行参数。
- Next.js框架的特点:Next.js是一个支持服务器端渲染和静态网站生成的React框架,适合构建现代的Web应用。
- TypeScript的作用和优势:TypeScript是JavaScript的一个超集,它提供了静态类型检查等特性,有助于提高代码质量和可维护性。
- 项目资源命名习惯:通常项目会有一个主目录,用来存放项目的源代码和核心配置文件,以便于项目的版本控制和团队协作。
以上内容基于给定的信息进行了深入的分析,为理解该项目的构建、运行方式以及技术栈提供了基础。在实际开发中,开发者应当参考更详细的文档和指南,以更高效地管理和部署基于Docker和TypeScript的Next.js项目。