【OpenCV图像显示神器:imshow函数深入解析与实战应用】
发布时间: 2024-08-12 12:31:01 阅读量: 182 订阅数: 25 
# 1. OpenCV图像显示基础
OpenCV(Open Source Computer Vision Library)是一个开源的计算机视觉库,它提供了广泛的图像处理和计算机视觉算法。图像显示是计算机视觉中一项基本任务,OpenCV提供了`imshow()`函数来轻松显示图像。
`imshow()`函数的语法结构为:`imshow(winname, image)`,其中`winname`是图像窗口的名称,`image`是需要显示的图像。`imshow()`函数会创建一个图像窗口并显示图像。如果图像窗口已经存在,则会更新窗口中的图像。
# 2. imshow函数的原理与实现
### 2.1 imshow函数的语法结构
```cpp
void imshow(const string& winname, const Mat& image);
```
| 参数 | 描述 |
|---|---|
| `winname` | 图像窗口的名称 |
| `image` | 要显示的图像 |
### 2.2 imshow函数的内部机制
imshow函数的内部实现主要分为以下几个步骤:
1. **创建图像窗口:**调用`namedWindow`函数创建指定名称的图像窗口。如果窗口已存在,则激活该窗口。
2. **图像数据复制:**将`image`中的图像数据复制到窗口的图像缓冲区中。
3. **图像显示:**调用`imshow`函数将图像缓冲区中的图像显示在窗口中。
**代码块:**
```cpp
void imshow(const string& winname, const Mat& image) {
// 创建图像窗口
namedWindow(winname);
// 图像数据复制
Mat dstImage;
image.copyTo(dstImage);
// 图像显示
imshow(winname, dstImage);
}
```
**代码逻辑分析:**
* `namedWindow`函数创建图像窗口,如果窗口已存在,则激活该窗口。
* `image.copyTo(dstImage)`将`image`中的图像数据复制到`dstImage`中,避免直接修改原始图像。
* `imshow`函数将`dstImage`中的图像显示在窗口中。
### 2.3 imshow函数的性能优化
imshow函数的性能优化主要集中在以下几个方面:
1. **图像数据复制优化:**使用`Mat::clone()`函数克隆图像数据,避免不必要的内存复制。
2. **图像显示优化:**使用`OpenGL`或`DirectX`等图形库加速图像显示。
3. **窗口管理优化:**使用`setWindowProperty`函数调整窗口大小和位置,减少窗口创建和销毁的开销。
**代码块:**
```cpp
void imshow(const string& winname, const Mat& image) {
// 图像数据复制优化
Mat dstImage = image.clone();
// 图像显示优化
setWindowProperty(winname, CV_WINDOW_OPENGL, true);
// 窗口管理优化
setWindowProperty(winname, CV_WINDOW_NORMAL, true);
// 图像显示
imshow(winname, dstImage);
}
```
**代码逻辑分析:**
* `image.clone()`函数克隆图像数据,避免不必要的内存复制。
* `setWindowProperty`函数设置窗口属性,启用`OpenGL`加速。
* `setWindowProperty`函数设置窗口属性,调整窗口大小和位置。
# 3. imshow函数的应用技巧
### 3.1 图像窗口的创建和销毁
imshow函数创建了一个图像窗口,用于显示图像。窗口的标题默认为图像的文件名,可以通过`cv2.namedWindow()`函数自定义窗口标题。
```python
import cv2
# 创建一个图像窗口
cv2.imshow("My Image", image)
# 等待用户按下任意键关闭窗口
cv2.waitKey(0)
cv2.destroyAllWindows()
```
`cv2.destroyAllWindows()`函数销毁所有创建的图像窗口。
### 3.2 图像的缩放和裁剪
#### 缩放
imshow函数可以通过`cv2.resize()`函数缩放图像。缩放比例可以通过`fx`和`fy`参数指定,分别表示x轴和y轴的缩放因子。
```python
# 将图像缩小一半
scaled_image = cv2.resize(image, (0, 0), fx=0.5, fy=0.5)
```
#### 裁剪
imshow函数可以通过`cv2.getRectSubPix()`函数裁剪图像。裁剪区域可以通过`rect`参数指定,是一个元组`(x, y, w, h)`,其中`(x, y)`是裁剪区域的左上角坐标,`w`和`h`是裁剪区域的宽度和高度。
```python
# 裁剪图像的中心部分
cropped_image = cv2.getRectSubPix(image, (100, 100), (50, 50))
```
### 3.3 图像的色彩空间转换
imshow函数可以通过`cv2.cvtColor()`函数转换图像的色彩空间。色彩空间可以通过`cv2.COLOR_BGR2GRAY`等常量指定。
```python
# 将图像转换为灰度图像
gray_image = cv2.cvtColor(image, cv2.COLOR_BGR2GRAY)
```
# 4. imshow函数的进阶应用
### 4.1 图像叠加和融合
imshow函数不仅可以显示单张图像,还可以叠加和融合多张图像。这在图像处理和计算机视觉中非常有用,例如:
- 图像配准:将两张图像对齐并叠加,以找出它们之间的差异。
- 图像融合:将多张图像融合成一张更具信息量的图像。
- 背景去除:将前景图像叠加到背景图像上,以去除背景。
#### 图像叠加
```cpp
import cv2
# 加载两张图像
image1 = cv2.imread("image1.jpg")
image2 = cv2.imread("image2.jpg")
# 创建一个与两张图像大小相同的黑色图像
blended = np.zeros((image1.shape[0], image1.shape[1], 3), np.uint8)
# 逐像素叠加两张图像
for i in range(image1.shape[0]):
for j in range(image1.shape[1]):
blended[i, j] = image1[i, j] + image2[i, j]
# 显示叠加后的图像
cv2.imshow("Blended Image", blended)
cv2.waitKey(0)
```
**代码逻辑分析:**
1. 加载两张图像并创建一个黑色图像作为叠加目标。
2. 遍历两张图像的像素,将对应的像素值相加并存储到叠加目标中。
3. 显示叠加后的图像。
#### 图像融合
```cpp
import cv2
# 加载两张图像
image1 = cv2.imread("image1.jpg")
image2 = cv2.imread("image2.jpg")
# 设置融合系数(0-1)
alpha = 0.5
# 创建一个与两张图像大小相同的黑色图像
fused = np.zeros((image1.shape[0], image1.shape[1], 3), np.uint8)
# 逐像素融合两张图像
for i in range(image1.shape[0]):
for j in range(image1.shape[1]):
fused[i, j] = (1 - alpha) * image1[i, j] + alpha * image2[i, j]
# 显示融合后的图像
cv2.imshow("Fused Image", fused)
cv2.waitKey(0)
```
**代码逻辑分析:**
1. 加载两张图像并创建一个黑色图像作为融合目标。
2. 设置融合系数,表示两张图像在融合结果中的权重。
3. 遍历两张图像的像素,将对应的像素值按比例融合并存储到融合目标中。
4. 显示融合后的图像。
### 4.2 图像标注和注释
imshow函数还可以用于图像标注和注释,这在图像分析和可视化中非常有用。
#### 图像标注
```cpp
import cv2
# 加载图像
image = cv2.imread("image.jpg")
# 创建一个矩形框的坐标
x, y, w, h = 100, 100, 200, 200
# 在图像上绘制矩形框
cv2.rectangle(image, (x, y), (x + w, y + h), (0, 255, 0), 2)
# 显示标注后的图像
cv2.imshow("Annotated Image", image)
cv2.waitKey(0)
```
**代码逻辑分析:**
1. 加载图像并定义矩形框的坐标。
2. 使用`cv2.rectangle()`函数在图像上绘制矩形框,指定颜色和线宽。
3. 显示标注后的图像。
#### 图像注释
```cpp
import cv2
# 加载图像
image = cv2.imread("image.jpg")
# 创建一个文本注释
text = "This is an image"
# 在图像上绘制文本注释
cv2.putText(image, text, (100, 100), cv2.FONT_HERSHEY_SIMPLEX, 1, (0, 255, 0), 2)
# 显示注释后的图像
cv2.imshow("Annotated Image", image)
cv2.waitKey(0)
```
**代码逻辑分析:**
1. 加载图像并定义文本注释。
2. 使用`cv2.putText()`函数在图像上绘制文本注释,指定字体、大小、颜色和线宽。
3. 显示注释后的图像。
# 5. imshow函数的实战应用
### 5.1 图像处理流水线
在实际应用中,imshow函数通常被集成到图像处理流水线中,作为图像处理结果的可视化工具。一个典型的图像处理流水线可能包含以下步骤:
- **图像获取:**从文件、摄像头或其他来源获取图像。
- **图像预处理:**对图像进行预处理,例如调整大小、转换颜色空间或应用滤波器。
- **图像处理:**对图像进行处理,例如目标检测、图像分割或特征提取。
- **图像显示:**使用imshow函数将处理后的图像可视化。
- **结果分析:**分析可视化的图像,并根据需要进行进一步的处理。
### 5.2 图像识别与分类
imshow函数在图像识别和分类任务中发挥着至关重要的作用。通过将图像可视化,可以方便地识别和分类图像中的对象。
**图像识别:**
```python
import cv2
# 加载图像
image = cv2.imread('image.jpg')
# 显示图像
cv2.imshow('Image', image)
cv2.waitKey(0)
cv2.destroyAllWindows()
```
**代码逻辑分析:**
- `cv2.imread('image.jpg')`:从文件中加载图像。
- `cv2.imshow('Image', image)`:显示图像,窗口标题为“Image”。
- `cv2.waitKey(0)`:等待用户按任意键关闭窗口。
- `cv2.destroyAllWindows()`:销毁所有打开的窗口。
**图像分类:**
```python
import cv2
import numpy as np
# 加载图像
image = cv2.imread('image.jpg')
# 转换为灰度图像
gray = cv2.cvtColor(image, cv2.COLOR_BGR2GRAY)
# 二值化图像
thresh = cv2.threshold(gray, 127, 255, cv2.THRESH_BINARY)[1]
# 查找轮廓
cnts = cv2.findContours(thresh, cv2.RETR_EXTERNAL, cv2.CHAIN_APPROX_SIMPLE)
cnts = cnts[0] if len(cnts) == 2 else cnts[1]
# 遍历轮廓并显示
for c in cnts:
# 计算轮廓的面积
area = cv2.contourArea(c)
# 如果面积大于某个阈值,则认为是对象
if area > 100:
# 计算轮廓的边界矩形
x, y, w, h = cv2.boundingRect(c)
# 在图像上绘制边界矩形
cv2.rectangle(image, (x, y), (x + w, y + h), (0, 255, 0), 2)
# 显示图像
cv2.imshow('Image', image)
cv2.waitKey(0)
cv2.destroyAllWindows()
```
**代码逻辑分析:**
- `cv2.cvtColor(image, cv2.COLOR_BGR2GRAY)`:将图像转换为灰度图像。
- `cv2.threshold(gray, 127, 255, cv2.THRESH_BINARY)[1]`:对灰度图像进行二值化,阈值设为 127。
- `cv2.findContours(thresh, cv2.RETR_EXTERNAL, cv2.CHAIN_APPROX_SIMPLE)`:查找图像中的轮廓。
- `for c in cnts:`:遍历轮廓。
- `area = cv2.contourArea(c)`:计算轮廓的面积。
- `if area > 100:`:如果面积大于阈值,则认为是对象。
- `x, y, w, h = cv2.boundingRect(c)`:计算轮廓的边界矩形。
- `cv2.rectangle(image, (x, y), (x + w, y + h), (0, 255, 0), 2)`:在图像上绘制边界矩形。
# 6. imshow函数的性能优化
### 6.1 图像显示的优化策略
**1. 减少不必要的窗口创建和销毁**
频繁创建和销毁窗口会消耗大量的系统资源。为了优化性能,应尽可能复用现有的窗口,而不是每次显示图像时都创建新的窗口。
**2. 使用适当的图像格式**
不同的图像格式具有不同的处理效率。对于实时显示的图像,建议使用轻量级的格式,如 JPEG 或 PNG。
**3. 优化图像大小**
显示大尺寸图像会占用更多的内存和处理时间。在显示图像之前,应根据需要调整图像大小,以减少资源消耗。
**4. 启用硬件加速**
现代计算机通常配备了图形处理单元 (GPU),可以加速图像处理任务。通过启用硬件加速,可以显著提高图像显示的性能。
### 6.2 内存管理与资源释放
**1. 避免内存泄漏**
图像显示过程中会分配大量的内存,如果处理不当,可能会导致内存泄漏。确保在不再需要图像时及时释放内存,以防止系统资源耗尽。
**2. 使用共享内存**
在多线程环境中,图像数据可能需要在多个线程之间共享。使用共享内存机制可以避免不必要的内存复制,提高性能。
**3. 优化内存分配策略**
选择合适的内存分配策略可以减少内存碎片,提高内存利用率。考虑使用内存池或内存对齐技术来优化内存分配。
**4. 及时释放资源**
当图像显示窗口不再需要时,应及时释放与之关联的所有资源,包括窗口句柄、图像数据和共享内存。这有助于防止资源泄漏和系统不稳定。

 百万级
高质量VIP文章无限畅学
百万级
高质量VIP文章无限畅学
 千万级
优质资源任意下载
千万级
优质资源任意下载
 C知道
免费提问 ( 生成式Al产品 )
C知道
免费提问 ( 生成式Al产品 )
0
0
相关推荐

专栏简介
OpenCV imshow 专栏深入探讨了 OpenCV 图像显示函数 imshow 的方方面面。从基础解析到实战应用,从优化技巧到进阶指南,从性能提升到跨平台移植,从故障排查到替代方案,从最佳实践到调试利器,再到数据探索、交互式显示、机器学习、计算机视觉、工业自动化、无人驾驶和增强现实等领域的应用,本专栏提供了全面的 imshow 使用指南,帮助开发者充分利用这一图像显示神器,解决图像处理、可视化、用户界面、模型训练和评估、图像识别、缺陷检测、环境感知和虚拟现实等领域的显示需求。
专栏目录
最低0.47元/天 解锁专栏
买1年送3月
百万级
高质量VIP文章无限畅学
千万级
优质资源任意下载
C知道
免费提问 ( 生成式Al产品 )
最新推荐
【跨模块协同效应】:SAP MM与PP结合优化库存管理的5大策略

# 摘要
本文旨在探讨SAP MM(物料管理)和PP(生产计划)模块在库存管理中的核心应用与协同策略。首先介绍了库存管理的基础理论,重点阐述了SAP MM模块在材料管理和库存控制方面的作用,以及PP模块如何与库存管理紧密结合实现生产计划的优化。接着,文章分析了SAP MM与PP结合的协同策略,包括集成供应链管理和需求驱动的库存管理方法,以减少库存
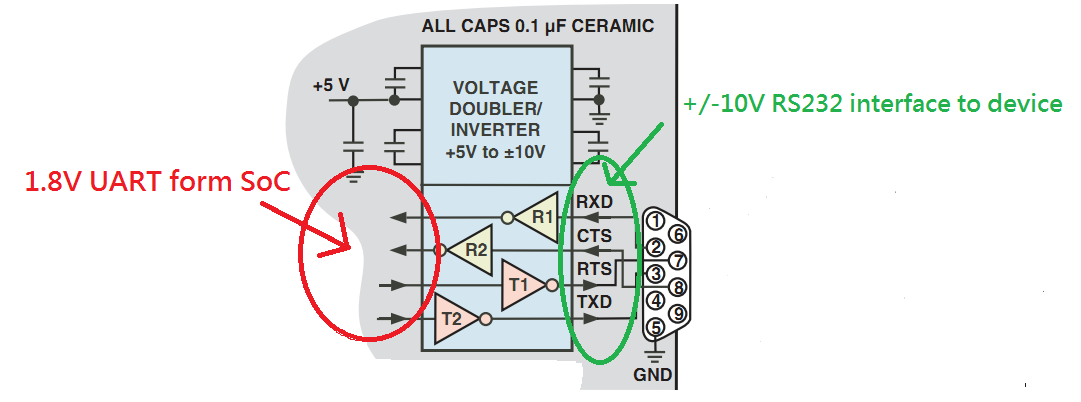
【接口保护与电源管理】:RS232通信接口的维护与优化
# 摘要
本文全面探讨了RS232通信接口的设计、保护策略、电源管理和优化实践。首先,概述了RS232的基本概念和电气特性,包括电压标准和物理连接方式。随后,文章详细分析了接口的保护措施,如静电和过电压防护、物理防护以及软件层面的错误检测机制。此外,探讨了电源管理技术,包括低功耗设计和远程通信设备的案例
零基础Pycharm教程:如何添加Pypi以外的源和库

# 摘要
Pycharm作为一款流行的Python集成开发环境(IDE),为开发人员提供了丰富的功能以提升工作效率和项目管理能力。本文从初识Pycharm开始,详细介绍了环境配置、自定义源与库安装、项目实战应用以及高级功能的使用技巧。通过系统地讲解Pycharm的安装、界面布局、版本控制集成,以及如何添加第三方源和手动安装第三方库,本文旨在帮助读者全面掌握Pycharm的使用,特
【ArcEngine进阶攻略】:实现高级功能与地图管理(专业技能提升)

# 摘要
本文深入介绍了ArcEngine的基本应用、地图管理与编辑、空间分析功能、网络和数据管理以及高级功能应用。首先,本文概述了ArcEngine的介绍和基础使用,然后详细探讨了地图管理和编辑的关键操作,如图层管理、高级编辑和样式设置。接着,文章着重分析了空间分析的基础理论和实际应用,包括缓冲区分析和网络分析。在此基础上,文章继续阐述了网络和数据库的基本操作
【VTK跨平台部署】:确保高性能与兼容性的秘诀

# 摘要
本文详细探讨了VTK(Visualization Toolkit)跨平台部署的关键方面。首先概述了VTK的基本架构和渲染引擎,然后分析了在不同操作系统间进行部署时面临的挑战和优势。接着,本文提供了一系列跨平台部署策略,包括环境准备、依赖管理、编译和优化以及应用分发。此外,通过高级跨平台功能的
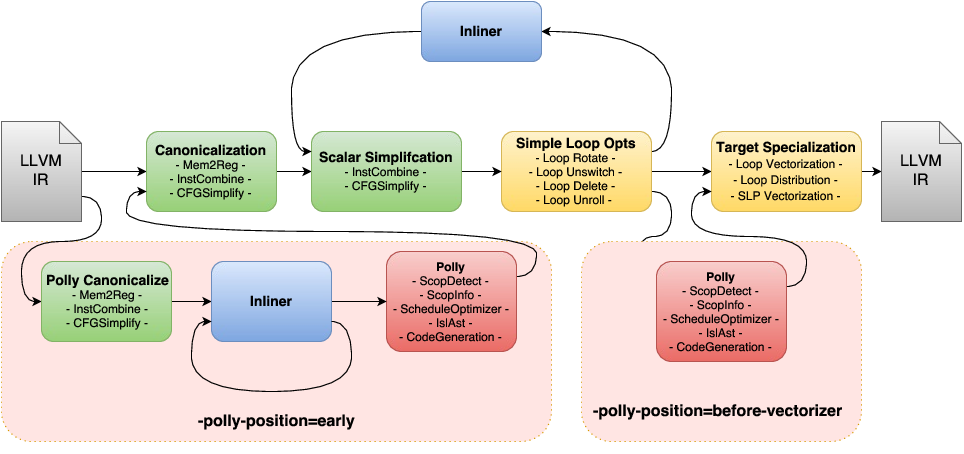
函数内联的权衡:编译器优化的利与弊全解
# 摘要
函数内联是编译技术中的一个优化手段,通过将函数调用替换为函数体本身来减少函数调用的开销,并有可能提高程序的执行效率。本文从基础理论到实践应用,全面介绍了函数内联的概念、工作机制以及与程序性能之间的关系。通过分析不同编译器的内联机制和优化选项,本文进一步探讨了函数内联在简单和复杂场景下的实际应用案例。同时,文章也对函数内联带来的优势和潜在风险进行了权衡分析,并给出了相关的优化技
【数据处理差异揭秘】

# 摘要
数据处理是一个涵盖从数据收集到数据分析和应用的广泛领域,对于支持决策过程和知识发现至关重要。本文综述了数据处理的基本概念和理论基础,并探讨了数据处理中的传统与现代技术手段。文章还分析了数据处理在实践应用中的工具和案例,尤其关注了金融与医疗健康行业中的数据处理实践。此外,本文展望了数据处理的未来趋势,包括人工智能、大数据、云计算、边缘计算和区块链技术如何塑造数据处理的未来。通过对数据治理和
C++安全编程:防范ASCII文件操作中的3个主要安全陷阱

# 摘要
本文全面介绍了C++安全编程的核心概念、ASCII文件操作基础以及面临的主要安全陷阱,并提供了一系列实用的安全编程实践指导。文章首先概述C++安全编程的重要性,随后深入探讨ASCII文件与二进制文件的区别、C++文件I/O操作原理和标准库中的文件处理方法。接着,重点分析了C++安全编程中的缓冲区溢出、格式化字符串漏洞和字符编码问题,提出相应的防范
时间序列自回归移动平均模型(ARMA)综合攻略:与S命令的完美结合
# 摘要
时间序列分析是理解和预测数据序列变化的关键技术,在多个领域如金融、环境科学和行为经济学中具有广泛的应用。本文首先介绍了时间序列分析的基础知识,特别是自回归移动平均(ARMA)模型的定义、组件和理论架构。随后,详细探讨了ARMA模型参数的估计、选择标准、模型平稳性检验,以及S命令语言在实现ARMA模型中的应用和案例分析。进一步,本文探讨了季节性ARMA模
资源上传下载、课程学习等过程中有任何疑问或建议,欢迎提出宝贵意见哦~我们会及时处理!
点击此处反馈


专栏目录
最低0.47元/天 解锁专栏
买1年送3月
百万级
高质量VIP文章无限畅学
千万级
优质资源任意下载
C知道
免费提问 ( 生成式Al产品 )