信号频率分析:雷达系统成像技术的核心原理
发布时间: 2024-07-12 07:35:35 阅读量: 43 订阅数: 41 

雷达成像技术(保铮).pdf

# 1. 信号频率分析基础
信号频率分析是雷达系统中一项至关重要的技术,它可以揭示信号中包含的频率信息,从而为目标识别、运动检测和成像提供依据。
频率分析的基本原理是傅里叶变换,它将时域信号转换为频域信号。频域信号可以直观地显示信号中不同频率分量的幅度和相位信息。通过分析频域信号,我们可以提取目标的特征信息,例如速度、距离和形状。
除了傅里叶变换之外,还有其他一些信号频率分析技术,例如短时傅里叶变换和小波变换。这些技术可以提供更精细的时间-频率分辨率,从而可以更准确地分析信号中的瞬时频率变化。
# 2 雷达系统中的信号频率分析
### 2.1 雷达信号的频谱特性
雷达信号的频谱特性是雷达系统中信号频率分析的基础。雷达信号的频谱特性取决于雷达的类型和工作模式。
#### 2.1.1 连续波雷达信号
连续波(CW)雷达发射连续的正弦波信号。CW雷达信号的频谱特性是一个窄带谱,中心频率为雷达的发射频率。
#### 2.1.2 脉冲雷达信号
脉冲雷达发射一系列脉冲信号。脉冲雷达信号的频谱特性是一个宽带谱,中心频率为雷达的发射频率,带宽取决于脉冲宽度。
### 2.2 信号频率分析技术
信号频率分析技术是提取雷达信号中频率信息的方法。常用的信号频率分析技术包括傅里叶变换、短时傅里叶变换和小波变换。
#### 2.2.1 傅里叶变换
傅里叶变换将时域信号转换为频域信号。傅里叶变换的输出是一个幅度谱和相位谱,其中幅度谱表示信号在不同频率上的能量分布,相位谱表示信号在不同频率上的相位分布。
```python
import numpy as np
import matplotlib.pyplot as plt
# 定义时域信号
time = np.linspace(0, 1, 1000)
signal = np.sin(2 * np.pi * 100 * time) + np.sin(2 * np.pi * 200 * time)
# 进行傅里叶变换
fft = np.fft.fft(signal)
fft_abs = np.abs(fft)
fft_phase = np.angle(fft)
# 绘制幅度谱和相位谱
plt.subplot(2, 1, 1)
plt.plot(time, fft_abs)
plt.xlabel('Time (s)')
plt.ylabel('Amplitude')
plt.title('Amplitude Spectrum')
plt.subplot(2, 1, 2)
plt.plot(time, fft_phase)
plt.xlabel('Time (s)')
plt.ylabel('Phase')
plt.title('Phase Spectrum')
plt.show()
```
**代码逻辑分析:**
1. `np.fft.fft(signal)`:对时域信号进行傅里叶变换,得到复数频域信号。
2. `np.abs(fft)`:取频域信号的幅度,得到幅度谱。
3. `np.angle(fft)`:取频域信号的相位,得到相位谱。
4. `plt.plot()`:绘制幅度谱和相位谱。
#### 2.2.2 短时傅里叶变换
短时傅里叶变换(STFT)是傅里叶变换的一种扩展,它将信号划分为一系列重叠的时窗,然后对每个时窗进行傅里叶变换。STFT的输出是一个时频图,其中横轴表示时间,纵轴表示频率,颜色表示信号在不同时间和频率上的能量分布。
```python
import librosa
# 定义时域信号
time = np.linspace(0, 1, 1000)
signal = np.sin(2 * np.pi * 100 * time) + np.sin(2 * np.pi * 200 * time)
# 进行短时傅里叶变换
stft = librosa.stft(signal, n_fft=1024, hop_length=512)
stft_abs = np.abs(stft)
# 绘制时频图
plt.imshow(stft_abs, aspect='auto', origin='lower')
plt.xlabel('Time (s)')
plt.ylabel('Frequency (Hz)')
plt.title('Short-Time Fourier Transform')
plt.show()
```
**代码逻辑分析:**
1. `librosa.stft()`:对时域信号进行短时傅里叶变换,得到时频图。
2. `np.abs(stft)`:取时频图的幅度,得

 百万级
高质量VIP文章无限畅学
百万级
高质量VIP文章无限畅学
 千万级
优质资源任意下载
千万级
优质资源任意下载
 C知道
免费提问 ( 生成式Al产品 )
C知道
免费提问 ( 生成式Al产品 )
0
0
相关推荐

专栏简介
“信号频率”专栏深入探讨了通信系统中信号频率这一关键指标。通过一系列文章,专栏提供了实用指南,帮助读者掌握信号频率分析的技巧,提升通信系统性能,解决故障,并优化设计。专栏涵盖了广泛的应用领域,包括移动通信、蜂窝网络、卫星通信、万物互联、自动驾驶、雷达系统等。通过深入浅出的讲解和实用案例,专栏旨在赋能读者,让他们能够充分利用信号频率分析,优化通信系统,并解锁技术创新的潜力。
专栏目录

文章持续更新中,敬请期待~
最低0.47元/天 解锁专栏
买1年送3月
百万级
高质量VIP文章无限畅学
千万级
优质资源任意下载
C知道
免费提问 ( 生成式Al产品 )
最新推荐
【天龙八部架构解析】:20年经验技术大佬揭示客户端架构与性能提升秘诀

# 摘要
随着客户端架构的不断演进和业务需求的提升,性能优化成为了至关重要的环节。本文首先概述了客户端架构及其性能提升的基础理论,强调了性能优化的核心原则和资源管理策略。随后,文章详细介绍了架构实践技巧,包括编写高效代码的最佳实践和系统调优方法。进一步,本文
RC滤波器设计指南:提升差分输入ADC性能
# 摘要
RC滤波器作为一种基础且广泛应用于电子电路中的滤波元件,其设计和性能优化对信号处理和电源管理至关重要。本文首先介绍了RC滤波器的基础知识和设计原则,然后深入探讨了低通、高通、带通及带阻滤波器的理论与构建方法。实践设计章节着重于元件选择、电路布局调试以及与差分输入ADC的整合。性能提升章节阐述了级联技术、非理想因素的补偿以及优化策略。最后,本文分析了RC滤波器在不同领域的应用案例,并对其未来的发展趋势进行了展望,包括新型材料和技术的融入、设计软件智能化以及跨学科融合对RC滤波器设计的影响。
# 关键字
RC滤波器;设计原则;信号处理;电源管理;性能优化;智能化发展;跨学科融合
参考
【Visual C++ 2010运行库高级内存管理技巧】:性能调优详解
# 摘要
本文深入探讨了内存管理的基础理论及实践技巧,特别针对Visual C++ 2010环境下的应用。文章从内存分配机制入手,阐述了内存分配的基本概念、内存分配函数的使用与特性、以及内存泄漏的检测与预防方法。进而,本文提出针对数据结构和并发环境的内存管理优化策略,包括数据对齐、内存池构建和多线程内存管理等技术。在高级内存管理技巧章节,文章详细介绍了智能指针、内存映射和大页技术,并展
【TIA博途教程】:从0到精通,算术平均值计算的终极指南

# 摘要
算术平均值是统计学中一个基础而重要的概念,它代表了数据集中趋势的一个度量。本文首先介绍了算术平均值的定义和数学表达,接着探讨了其在统计学中的应用及其与其他统计指标的关系。随后,文章详细阐述了单变量与多变量数据集中算术平均值的计算方法和技巧,包括异常值处理和加权平均数的计算。通过介绍TIA博途软件环境下的算术平
CCS库文件生成终极优化:专家分享最佳实践与技巧
# 摘要
本文全面探讨了CCS库文件的生成和优化过程,包括基础知识、优化理论、实践应用和高级技巧。文章首先介绍了CCS库文件的生成环境搭建和基本生成流程,然后深入探讨了性能优化、内存管理和编译器优化的基本原则和策略,以及如何在实践中有效实施。接着,文中强调了多线程编程和算法优化在提升CCS库文件性能中的重要性,并提供了系统级优化的实践案例。通过案例分析,本文对比了成功与失败的优化实践,总结了经验教训,并展望了CCS库文件优化的未来趋势,以及面临的技术挑战和研究前景。
# 关键字
CCS库文件;性能优化;内存管理;编译器优化;多线程编程;系统级优化
参考资源链接:[CCS环境下LIB文件生成
【Linux二进制文件执行障碍全攻略】:权限、路径、依赖问题的综合处理方案
# 摘要
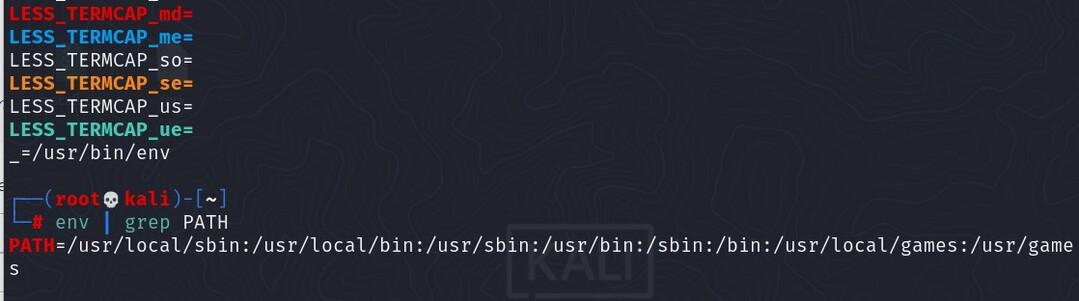
本文详细探讨了Linux环境下二进制文件执行过程中的权限管理、路径问题以及依赖性问题,并提出相应的解决策略。首先,介绍了二进制文件的执行权限基础,阐述了权限不足时常见的问题以及解决方法,并分析了特殊权限位配置的重要性。其次,深入分析了环境变量PATH的作用、路径错误的常见表现和排查方法,以及如何修复路径问题。然后,对二进制文件的依赖性问题进行了分类和诊
【CMOS电路设计习题集】:理论与实践的桥梁,成为电路设计大师的秘诀
# 摘要
本文全面探讨了CMOS电路设计的基础知识、理论分析、实践应用、进阶技巧以及面临的设计挑战和未来趋势。首先,介绍了CMOS电路设计的基本概念和理论基础,包括NMOS和PMOS晶体管特性及其在逻辑门电路中的应用。随后,文中详细分析了CMOS电路的动态特性,包括开关速度、电荷共享以及功耗问题,并提出了解决方案。在设计实践部分,本文阐述了从概念设计到物理实现的流程和仿真验证方法,并举例说明了EDA工具在设计中的应用。进阶技巧章节专注于高速和低功耗设计,以及版图设计的优化策略。最后,探讨了CMOS电路设计的当前挑战和未来技术发展,如材料技术进步和SoC设计趋势。本文旨在为从事CMOS电路设计的
5G NR无线网络同步的权威指南:掌握核心同步机制及优化策略
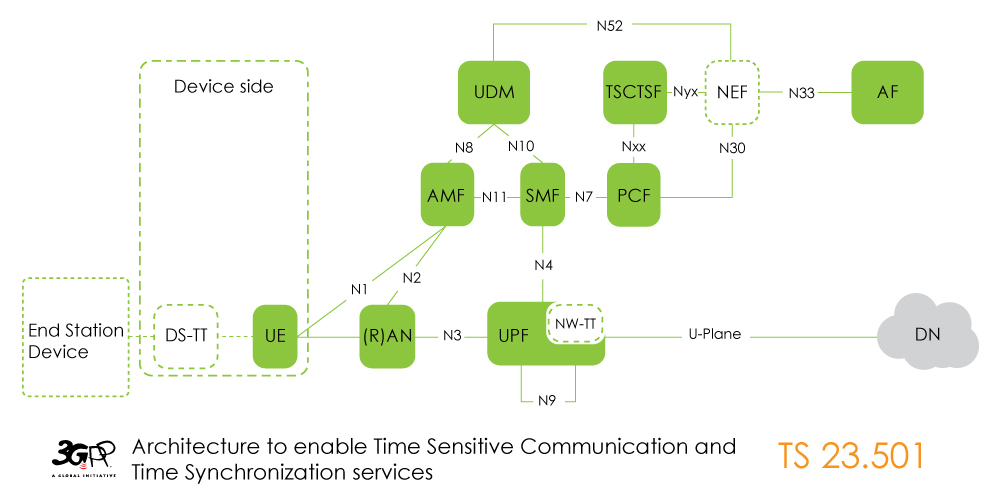
# 摘要
本文综述了5G NR无线网络同步的关键技术、优化策略以及未来发展趋势。文章首先概述了5G NR的无线网络同步概念,随后深入探讨了核心同步机制,包括同步信号和参考信号的定义、时间同步与频率同步的原理及其关键技术。接着,文章分析了同步精度对性能的影响,并提出了相应的优化方法。在实际网络环境中的同步挑战和对策也得到了详细讨论。文章还通过案例分析的方式,对同步问题的诊断和故障处理
蓝牙5.4行业应用案例深度剖析:技术落地的探索与创新

# 摘要
蓝牙技术自问世以来,经历了不断的演进与发展,特别是蓝牙5.4标准的发布,标志着蓝牙技术在传输速率、定位功能、音频传输、安全保护等多个方面取得了显著的提升。本文系统地解析了蓝牙5.4的关键技术,并探讨了其在物联网、消费电子以及工业应用中的创新实践。同时,文章分析了蓝牙5.4在实际部署中面临的挑战,并提出了相应的解决策略。最
资源上传下载、课程学习等过程中有任何疑问或建议,欢迎提出宝贵意见哦~我们会及时处理!
点击此处反馈


专栏目录
文章持续更新中,敬请期待~
最低0.47元/天 解锁专栏
买1年送3月
百万级
高质量VIP文章无限畅学
千万级
优质资源任意下载
C知道
免费提问 ( 生成式Al产品 )