MATLAB读取NetCDF文件:数据处理大全,对数据进行各种操作,提升数据利用率
发布时间: 2024-06-11 03:05:28 阅读量: 12 订阅数: 14 
# 1. MATLAB读取NetCDF文件
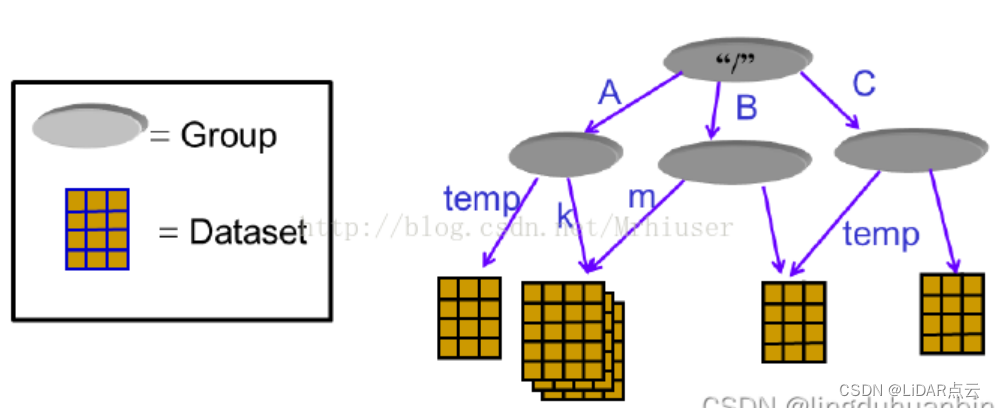
NetCDF(网络通用数据格式)是一种广泛用于存储和共享科学数据的自描述数据格式。MATLAB提供了一系列函数,使我们能够轻松读取和处理NetCDF文件。
### 读取NetCDF文件
使用`ncread`函数可以读取NetCDF文件中的数据。该函数接受三个参数:文件路径、变量名称和索引。例如,以下代码读取NetCDF文件`data.nc`中的`temperature`变量:
```
temperature = ncread('data.nc', 'temperature');
```
### 获取文件信息
除了读取数据外,MATLAB还提供了函数来获取有关NetCDF文件的信息。`ncinfo`函数返回文件中的变量、维度和属性的信息。例如,以下代码获取文件`data.nc`中的变量信息:
```
info = ncinfo('data.nc');
```
# 2. NetCDF文件数据处理技巧
### 2.1 数据提取和转换
#### 2.1.1 数据提取的基本方法
NetCDF文件中的数据可以通过多种方法提取。最简单的方法是使用`ncread`函数,它允许用户指定变量名称和索引来提取数据。例如,以下代码从`temperature.nc`文件中提取变量`temperature`:
```matlab
temperature = ncread('temperature.nc', 'temperature');
```
对于更复杂的数据提取,可以使用`ncgetvar`函数。此函数允许用户指定变量名称、索引和操作,例如求和或平均。例如,以下代码从`temperature.nc`文件中提取变量`temperature`的平均值:
```matlab
temperature_mean = ncgetvar('temperature.nc', 'temperature', 'mean');
```
#### 2.1.2 数据类型转换和格式化
提取的数据可能需要转换为不同的数据类型或格式。MATLAB提供了多种函数来执行此操作,例如`double`、`single`和`char`。例如,以下代码将变量`temperature`转换为双精度浮点数:
```matlab
temperature = double(temperature);
```
还可以使用`num2str`和`str2num`函数将数据转换为字符串和数字。例如,以下代码将变量`temperature`转换为字符串:
```matlab
temperature_str = num2str(temperature);
```
### 2.2 数据操作和分析
#### 2.2.1 数据统计和聚合
MATLAB提供了多种函数来执行数据统计和聚合,例如`mean`、`std`和`sum`。例如,以下代码计算变量`temperature`的平均值:
```matlab
temperature_mean = mean(temperature);
```
还可以使用`accumarray`函数对数据进行分组和聚合。例如,以下代码计算每个时间步长变量`temperature`的平均值:
```matlab
temperature_mean_by_time = accumarray(time, temperature, [], @mean);
```
#### 2.2.2 数据可视化和图表生成
MATLAB提供了多种函数来生成数据可视化和图表,例如`plot`、`bar`和`histogram`。例如,以下代码绘制变量`temperature`的时间序列图:
```matlab
plot(time, temperature);
xlabel('Time');
ylabel('Temperature');
title('Temperature Time Series');
```
还可以使用`subplot`函数创建多个子图。例如,以下代码在同一图形中绘制变量`temperature`和`pressure`的时间序列图:
```matlab
subplot(2, 1, 1);
plot(time, temperature);
xlabel('Time');
ylabel('Temperature');
title('Temperature Time Series');
subplot(2, 1, 2);
plot(time, pressure);
xlabel('Time');
ylabel('Pressure');
title('Pressure Time Series');
```
# 3. NetCDF文件数据处理实践
### 3.1 气象数据分析
#### 3.1.1 气温和降水数据的提取和可视化
**数据提取**
```
% 读取 NetCDF 文件
ncid = netcdf.open('weather_data.nc', 'NC_NOWRITE');
% 提取气温数据
temperature = netcdf.getVar(ncid, 'temperature');
% 提取降水数据
precipitation = netcdf.getVar(ncid, 'precipitation');
% 关闭 NetCDF 文件
netcdf.close(ncid);
```
**逻辑分析**
* `netcdf.open` 函数打开 NetCDF 文件,并返回文件标识符 `ncid`。
* `netcdf.getVar` 函数提取指定变量的数据,并将其存储在变量中。
* `netcdf.close` 函数关闭 NetCDF 文件。
**参数说明**
* `weather_data.nc`:NetCDF 文件名
* `NC_NOWRITE`:只读模式
* `temperature`:气温变量名
* `precipitation`:降水变量名
**可视化**
```
% 创建气温和降水的时间序列图
figure;
% 绘制气温曲线
plot(temperature, 'b', 'LineWidth', 2);
hold on;
% 绘制降水曲线
plot(precipitation, 'r', 'LineWidth', 2);
% 设置图例
legend('Temperature', 'Precipitation');
xlabel('Time');
ylabel('Value');
title('Weather Data Analysis');
% 保存
```
 最低0.47元/天 解锁专栏
 送3个月
 百万级
高质量VIP文章无限畅学
百万级
高质量VIP文章无限畅学
 千万级
优质资源任意下载
千万级
优质资源任意下载
 C知道
免费提问 ( 生成式Al产品 )
C知道
免费提问 ( 生成式Al产品 )
0
0
相关推荐

专栏简介
欢迎来到 MATLAB 读取 NetCDF 文件的权威指南!本专栏将带你深入了解 MATLAB 中 NetCDF 文件读取的方方面面。从入门基础到精通技巧,从原理剖析到实战应用,我们为你提供了全面的指南。
本专栏涵盖了 NetCDF 文件读取的各个方面,包括:
* 揭秘幕后机制,让你理解 NetCDF 文件的结构和读取原理。
* 实战技巧,助你轻松读取海量数据,解决数据读取中的各种难题。
* 性能优化秘籍,提升数据读取效率,节省宝贵时间。
* 错误处理大全,应对数据读取中的各种挑战,确保数据完整性。
* 案例分析,解决实际数据读取问题,提升技能,应对复杂场景。
* 数据可视化指南,将数据转化为直观图表,提升洞察力,发现数据背后的故事。
* 数据分析秘籍,从数据中挖掘有价值的见解,提升决策力,做出明智选择。
* 数据处理大全,对数据进行各种操作,提升数据利用率,满足不同需求。
* 数据存储指南,将数据保存为 NetCDF 文件,提升数据安全性,确保数据持久化。
* 数据共享秘诀,与他人分享数据,提升协作效率,促进知识交流。
* 数据安全指南,保护数据免遭未经授权的访问,提升数据隐私,保障数据安全。
* 数据压缩秘籍,减少数据存储空间,提升数据管理效率,节省存储成本。
* 数据加密指南,保护数据隐私,提升数据安全性,防止数据泄露。
* 数据版本控制指南,管理数据更改,提升数据一致性,确保数据质量。
无论你是 NetCDF 文件读取的新手,还是经验丰富的专家,本专栏都能为你提供有价值的知识和技巧。让我们一起探索 MATLAB 读取 NetCDF 文件的奥秘,释放数据的无限潜力!
专栏目录
最低0.47元/天 解锁专栏
送3个月
百万级
高质量VIP文章无限畅学
千万级
优质资源任意下载
C知道
免费提问 ( 生成式Al产品 )
最新推荐
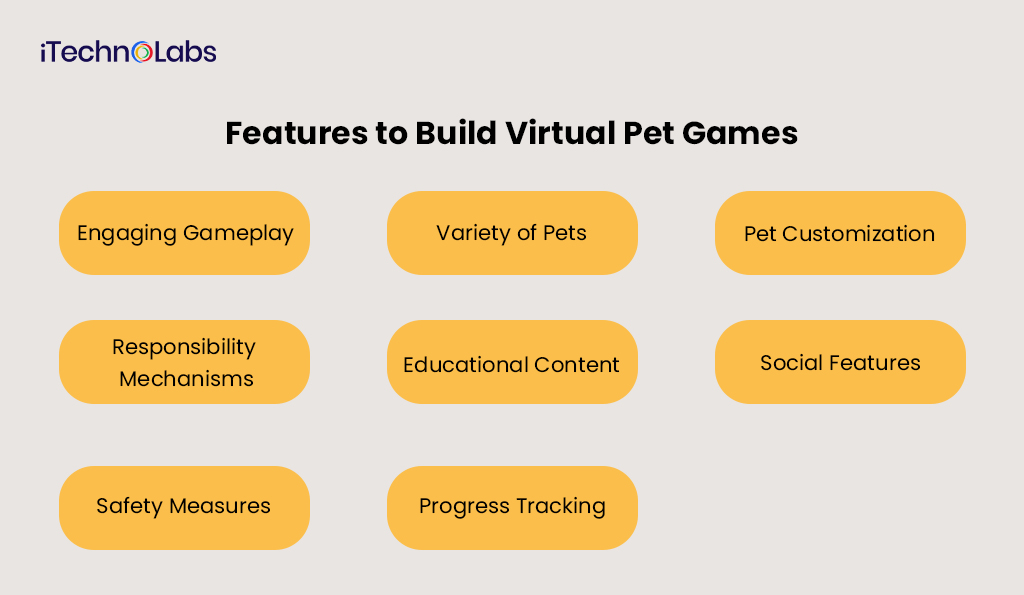
【实战演练】虚拟宠物:开发一个虚拟宠物游戏,重点在于状态管理和交互设计。
# 2.1 虚拟宠物的状态模型
### 2.1.1 宠物的基本属性
虚拟宠物的状态由一系列基本属性决定,这些属性描述了宠物的当前状态,包括:
- **生命值 (HP)**:宠物的健康状况,当 HP 为 0 时,宠物死亡。
- **饥饿值 (Hunger)**:宠物的饥饿程度,当 Hunger 为 0 时,宠物会饿死。
- **口渴
【实战演练】前沿技术应用:AutoML实战与应用

# 1. AutoML概述与原理**
AutoML(Automated Machine Learning),即自动化机器学习,是一种通过自动化机器学习生命周期
【实战演练】时间序列预测项目:天气预测-数据预处理、LSTM构建、模型训练与评估
# 1. 时间序列预测概述**
时间序列预测是指根据历史数据预测未来值。它广泛应用于金融、天气、交通等领域,具有重要的实际意义。时间序列数据通常具有时序性、趋势性和季节性等特点,对其进行预测需要考虑这些特性。
# 2. 数据预处理
### 2.1 数据收集和清洗
#### 2.1.1 数据源介绍
时间序列预测模型的构建需要可靠且高质量的数据作为基础。数据源的选择至关重要,它将影响模型的准确性和可靠性。常见的时序数据源包括:
【实战演练】构建简单的负载测试工具

# 1. 负载测试基础**
负载测试是一种性能测试,旨在模拟实际用户负载,评估系统在高并发下的表现。它通过向系统施加压力,识别瓶颈并验证系统是否能够满足预期性能需求。负载测试对于确保系统可靠性、可扩展性和用户满意度至关重要。
# 2. 构建负载测试工具
### 2.1 确定测试目标和指标
在构建负载测试工具之前,至关重要的是确定测试目标和指标。这将指导工具的设计和实现。以下是一些需要考虑的关键因素:
【进阶】入侵检测系统简介
# 1. 入侵检测系统概述**
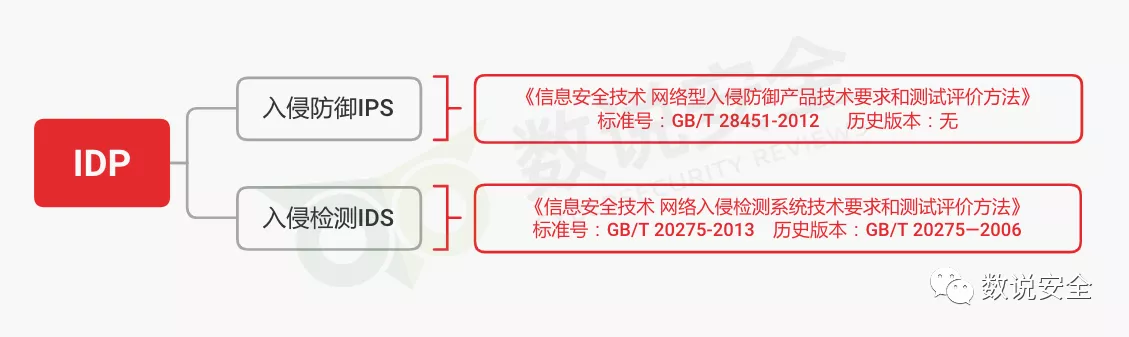
入侵检测系统(IDS)是一种网络安全工具,用于检测和预防未经授权的访问、滥用、异常或违反安全策略的行为。IDS通过监控网络流量、系统日志和系统活动来识别潜在的威胁,并向管理员发出警报。
IDS可以分为两大类:基于网络的IDS(NIDS)和基于主机的IDS(HIDS)。NIDS监控网络流量,而HIDS监控单个主机的活动。IDS通常使用签名检测、异常检测和行
【实战演练】综合案例:数据科学项目中的高等数学应用

# 1. 数据科学项目中的高等数学基础**
高等数学在数据科学中扮演着至关重要的角色,为数据分析、建模和优化提供了坚实的理论基础。本节将概述数据科学
【实战演练】通过强化学习优化能源管理系统实战
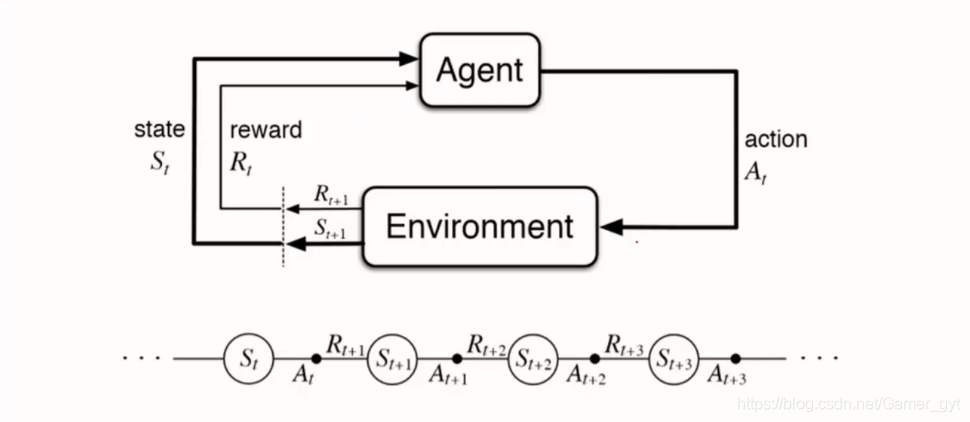
# 2.1 强化学习的基本原理
强化学习是一种机器学习方法,它允许智能体通过与环境的交互来学习最佳行为。在强化学习中,智能体通过执行动作与环境交互,并根据其行为的
【实战演练】深度学习在计算机视觉中的综合应用项目

# 1. 计算机视觉概述**
计算机视觉(CV)是人工智能(AI)的一个分支,它使计算机能够“看到”和理解图像和视频。CV 旨在赋予计算机人类视觉系统的能力,包括图像识别、对象检测、场景理解和视频分析。
CV 在广泛的应用中发挥着至关重要的作用,包括医疗诊断、自动驾驶、安防监控和工业自动化。它通过从视觉数据中提取有意义的信息,为计算机提供环境感知能力,从而实现这些应用。
# 2.1 卷积
【实战演练】使用Docker与Kubernetes进行容器化管理
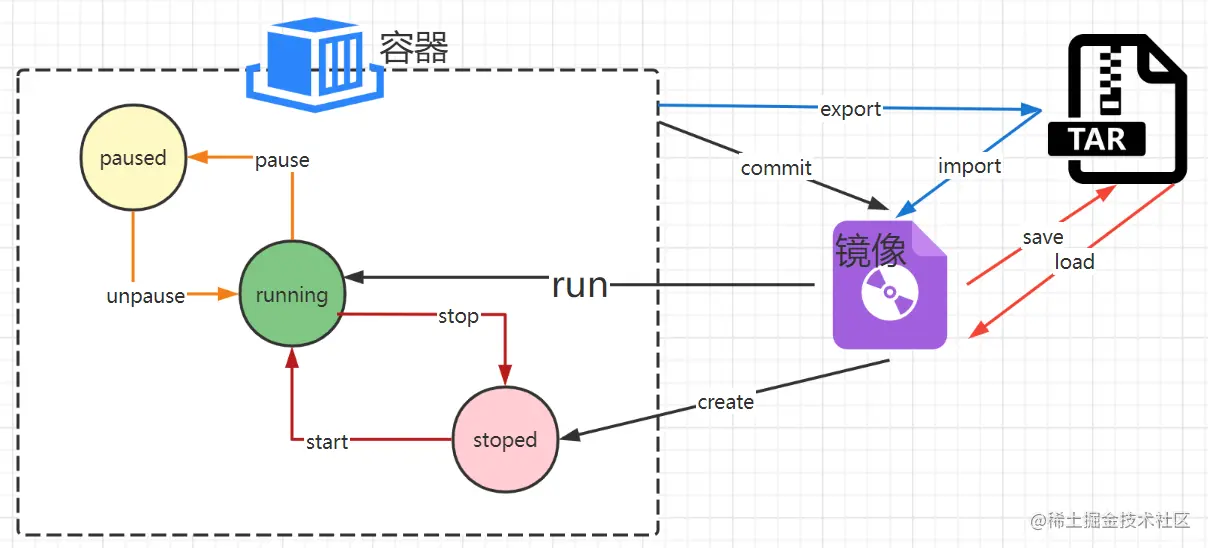
# 2.1 Docker容器的基本概念和架构
Docker容器是一种轻量级的虚拟化技术,它允许在隔离的环境中运行应用程序。与传统虚拟机不同,Docker容器共享主机内核,从而减少了资源开销并提高了性能。
Docker容器基于镜像构建。镜像是包含应用程序及
【实战演练】python云数据库部署:从选择到实施
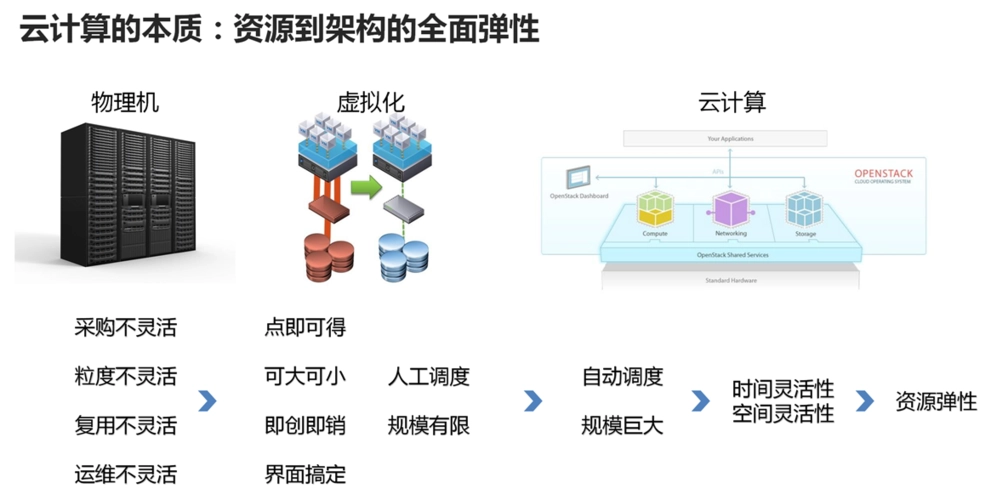
# 2.1 云数据库类型及优劣对比
**关系型数据库(RDBMS)**
* **优点:**
* 结构化数据存储,支持复杂查询和事务
* 广泛使用,成熟且稳定
* **缺点:**
* 扩展性受限,垂直扩展成本高
* 不适合处理非结构化或半结构化数据
**非关系型数据库(NoSQL)**
* **优点:**
* 可扩展性强,水平扩展成本低
资源上传下载、课程学习等过程中有任何疑问或建议,欢迎提出宝贵意见哦~我们会及时处理!
点击此处反馈


专栏目录
最低0.47元/天 解锁专栏
送3个月
百万级
高质量VIP文章无限畅学
千万级
优质资源任意下载
C知道
免费提问 ( 生成式Al产品 )