交通标志识别中的特征提取秘籍:OpenCV实战,精准识别交通标志
发布时间: 2024-08-09 12:31:52 阅读量: 28 订阅数: 38 

白色大气风格的旅游酒店企业网站模板.zip

# 1. 交通标志识别概述**
交通标志识别是一种计算机视觉技术,它使计算机能够识别和理解道路上的交通标志。该技术在智能交通系统、自动驾驶汽车和其他需要对道路环境进行实时理解的应用中至关重要。
交通标志识别系统通常涉及以下步骤:图像采集、图像预处理、特征提取、分类和结果展示。图像采集涉及使用摄像头或传感器获取道路图像。图像预处理包括图像增强、噪声去除和透视变换。特征提取涉及从图像中提取表示交通标志特征的特征,例如颜色、形状和纹理。分类涉及使用机器学习算法将提取的特征分类为不同的交通标志类别。最后,结果展示涉及将识别的交通标志可视化并与用户交互。
# 2. OpenCV基础
### 2.1 图像处理基础
#### 2.1.1 图像的表示和存储
图像在计算机中通常表示为一个多维数组,其中每个元素代表图像中一个像素的强度值。对于灰度图像,数组为二维,每个元素表示像素的亮度值;对于彩色图像,数组为三维,每个元素表示像素的红、绿、蓝(RGB)分量值。
图像存储格式有多种,常见的有:
- **BMP:**Windows位图格式,无压缩,文件较大。
- **JPEG:**联合图像专家组格式,有损压缩,文件较小,广泛用于网络传输。
- **PNG:**可移植网络图形格式,无损压缩,文件大小适中,支持透明度。
- **TIFF:**标记图像文件格式,无损压缩,文件较大,常用于专业图像处理。
#### 2.1.2 图像的变换和增强
图像变换和增强是图像处理中常用的操作,可以改善图像的视觉效果或提取有用的信息。
**图像变换:**
- **平移:**将图像沿水平或垂直方向移动。
- **旋转:**将图像绕中心点旋转一定角度。
- **缩放:**将图像放大或缩小。
- **透视变换:**将图像投影到一个新的平面。
**图像增强:**
- **亮度调整:**调整图像的整体亮度。
- **对比度调整:**调整图像中明暗区域之间的差异。
- **直方图均衡化:**调整图像的直方图,使图像中不同灰度级的分布更加均匀。
- **锐化:**增强图像中的边缘和细节。
### 2.2 特征提取技术
特征提取是图像处理中至关重要的一步,其目的是从图像中提取能够代表图像内容的特征。这些特征可以用于后续的图像识别、分类或分析。
#### 2.2.1 颜色直方图
颜色直方图是一种统计图像中不同颜色出现的频率的特征。它可以用来描述图像的整体颜色分布,并用于图像检索和分类。
#### 2.2.2 纹理分析
纹理是指图像中表面或物体表面的视觉模式。纹理分析可以提取图像中纹理特征,用于图像分类和识别。
#### 2.2.3 形状描述子
形状描述子用于描述图像中对象的形状。常见的形状描述子包括:
- **轮廓:**对象边界上的像素集合。
- **Hu不变矩:**描述对象形状的七个不变矩。
- **Zernike矩:**描述对象形状的无限个正交矩。
# 3. 交通标志特征提取实践
### 3.1 颜色特征提取
#### 3.1.1 RGB颜色空间
RGB颜色空间是一种将颜色表示为红(Red)、绿(Green)、蓝(Blue)三个分量的颜色模型。每个分量取值范围为0-255,表示该颜色分量的强度。RGB颜色空间广泛应用于图像处理和计算机图形学中。
```python
import cv2
# 读取图像
image = cv2.imread('traffic_sign.jpg')
# 将图像转换为RGB颜色空间
rgb_image = cv2.cvtColor(image, cv2.COLOR_BGR2RGB)
# 分离RGB分量
red_channel = rgb_image[:, :, 0]
green_channel = rgb_image[:, :, 1]
blue_channel = rgb_image[:, :, 2]
# 计算RGB分量的直方图
red_hist = cv2.calcHist([red_channel], [0], None, [256], [0, 256])
green_hist = cv2.calcHist([green_channel], [0], None, [256], [0, 256])
blue_hist = cv2.calcHist([blue_channel], [0], None, [256], [0, 256])
# 可视化RGB分量的直方图
plt.figure()
plt.subplot(131)
plt.plot(red_hist)
plt.title('Red Channel Histogram')
```

 百万级
高质量VIP文章无限畅学
百万级
高质量VIP文章无限畅学
 千万级
优质资源任意下载
千万级
优质资源任意下载
 C知道
免费提问 ( 生成式Al产品 )
C知道
免费提问 ( 生成式Al产品 )
0
0
相关推荐

专栏简介
欢迎来到 OpenCV 交通标志识别专栏!本专栏将带领您从入门到精通,解锁交通标志识别的奥秘。我们将深入探讨交通标志识别实战指南,揭秘基于 OpenCV 的实现,助力交通安全。您将掌握提升识别准确率的优化技巧,并了解交通标志识别系统的设计与实现,打造智慧交通。
专栏还将比较不同交通标志识别算法,分析 OpenCV 深度学习方法的优缺点。我们将分享图像预处理和特征提取秘籍,提升识别效率和精度。您将学习分类器选择与训练的技巧,提高识别性能。后处理技术将增强识别系统的鲁棒性,打造稳定可靠的识别系统。
此外,专栏还将介绍移动端交通标志识别实战,让您实现实时识别。我们将全面解析交通标志识别的理论和应用,掌握核心技术。边缘检测、形状识别、颜色识别、纹理分析和目标跟踪等技术将助力您精准识别交通标志,应对复杂交通场景。
专栏目录
最低0.47元/天 解锁专栏
买1年送3月
百万级
高质量VIP文章无限畅学
千万级
优质资源任意下载
C知道
免费提问 ( 生成式Al产品 )
最新推荐
【从零到一精通Fluent】:深入解析离散相模型核心概念与实战应用
# 摘要
本文全面介绍了Fluent离散相模型的基础理论、配置设置、分析方法以及高级应用。首先概述了离散相模型的物理和数学基础,随后详细阐述了在Fluent中如何配置和进行仿真分析,并对仿真结果进行后处理和优化。进一步,本文探讨了离散相模型的定制化开发,工业应用案例以及未来的发展趋势,包括高性能计算和机器学习技术的整合。最后,通过实战演练的方式,展示了从建模准备到仿真操作,再到结果分析与报告撰写
【ROSTCM自然语言处理基础】:从文本清洗到情感分析,彻底掌握NLP全过程
# 摘要
本文全面探讨了自然语言处理(NLP)的各个方面,涵盖了从文本预处理到高级特征提取、情感分析和前沿技术的讨论。文章首先介绍了NLP的基本概念,并深入研究了文本预处理与清洗的过程,包括理论基础、实践技术及其优
【Java集合框架:核心接口深入剖析】
# 摘要
Java集合框架为数据存储和操作提供了丰富的接口和类,是Java语言中不可或缺的一部分。本文首先概述了Java集合框架的基本概念及其核心接口的继承结构和特点。接着,详细探讨了List、Set和Map这些核心接口的具体实现,包括各自的工作原理和特性差异。第三章着重于集合框架的性能优化,包括如何根据不同的应用场景选择合适的集合类型,以及深入理解集合的扩容机制和内存管理。最后,本文通过实例阐
BP1048B2的可维护性提升:制定高效维护策略,专家教你这么做
# 摘要
本文详细探讨了BP1048B2系统的可维护性,涵盖了从理论基础到高级应用以及实践案例分析的全过程。首先,本文阐明了系统可维护性的定义、意义以及其在系统生命周期中的重要性,并介绍了提升可维护性的策略理论和评估方法。接着,文章深入介绍了在BP1048B2系统中实施维护策略的具体实践,包括维护流程优化、工具与技术的选择、持续改进及风险管理措施。进一步,本文探索了自动化技术、云原生维护以及智能监控和预测性
【蓝凌KMSV15.0:知识地图构建与应用指南】:高效组织知识的秘密

# 摘要
知识地图作为一种高效的知识管理工具,在现代企业中扮演着至关重要的角色。本文首先介绍了知识地图构建的理论基础,随后概述了蓝凌KMSV15.0系统的整体架构。通过详细阐述构建知识地图的实践流程,本文揭示了知识分类体系设计和标签管理的重要性,以及创建和编辑知识地图的有效方法和步骤。文章进一步探讨了知识地图在企业中的实际应用,包括提高知识管理效率、促进知识共享
【充电桩国际化战略】:DIN 70121标准的海外应用与挑战
# 摘要
随着全球电动车辆市场的快速发展,充电桩技术及其国际化应用变得日益重要。本文首先介绍了充电桩技术及其国际化背景,详细解读了DIN 70121标准的核心要求和技术参数,并探讨了其与国际标准的对接和兼容性。随后,本文分析了海外市场拓展的策略,包括市场分析、战略合作伙伴的选择与管理,以及法规合规与认证流程。接着,针对面临的挑战,提出了技术标准本地化适配、市场接受度提升以及竞争策略与品牌建设等解决方案。最后,通过对成功案例的研究,总结了行业面临的挑战与发展趋势,并提出了战略规划与持续发展的保障措施。
# 关键字
充电桩技术;DIN 70121标准;市场拓展;本地化适配;用户教育;品牌建设
SD4.0协议中文翻译版本详解
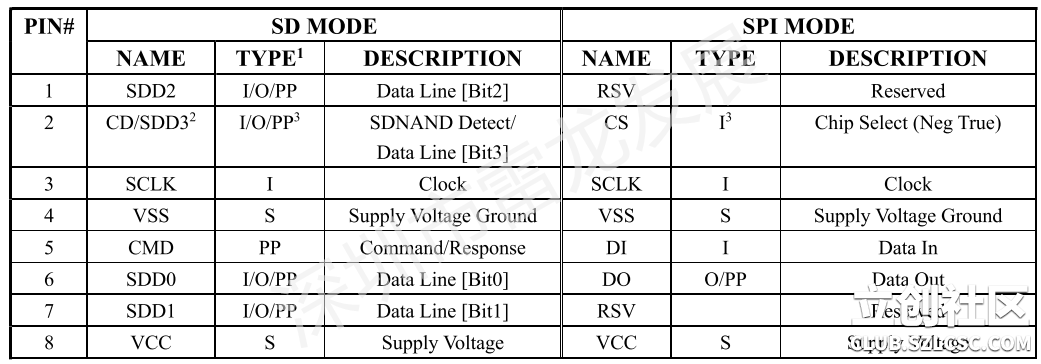
# 摘要
SD4.0协议作为数据存储领域的重要标准,通过其核心技术的不断演进,为数据存储设备和移动设备的性能提升提供了强有力的技术支持。本文对SD4.0协议进行了全面的概述,包括物理层的规范更新、数据传输机制的改进以及安全特性的增强。文章还详细对比分析了SD4.0协议的中文翻译版本,评估了翻译准确性并探讨了其应用场景。此外,本文通过对SD4
【51单片机电子时钟设计要点】:深度解析项目成功的关键步骤

# 摘要
本论文详细介绍了51单片机电子时钟项目的设计与实现过程。从硬件设计与选择到软件架构开发,再到系统集成与测试,每个关键环节均进行了深入探讨。章节二详细分析了51单片机特性选型,显示模块与电源模块的设计标准和实现方法。在软件设计方面,本文阐述了电子时钟软件架构及其关键功能模块,以及时间管理算法和用户交互的设计。系统集成与测试章节强调了软硬件协同工作的机制和集成过程中的问题解决策略。最后,
【数值计算高手进阶】:面积分与线积分的高级技术大公开

# 摘要
本文系统地探讨了数值计算与积分的基础理论及计算方法,特别是面积分和线积分的定义、性质和计算技巧。文中详细介绍了面积分和线积分的标准计算方法,如参数化方法、Green公式、Stokes定理等,以及它们的高级技术应用,如分片多项式近似和数值积分方法。此外,本文还分析了数值计算软件如MATLAB、Mathematica和Maple在积分计
Mamba SSM版本升级攻略:1.1.3到1.2.0的常见问题解答
# 摘要
本文详细论述了Mamba SSM版本从1.1.3升级到1.2.0的全过程,涵盖了升级前的准备工作、具体升级步骤、升级后的功能与性能改进以及遇到的问题和解决方法。通过环境评估、依赖性分析和数据备份,确
资源上传下载、课程学习等过程中有任何疑问或建议,欢迎提出宝贵意见哦~我们会及时处理!
点击此处反馈


专栏目录
最低0.47元/天 解锁专栏
买1年送3月
百万级
高质量VIP文章无限畅学
千万级
优质资源任意下载
C知道
免费提问 ( 生成式Al产品 )