SQL Server 2008 性能监视器详解:数据库健康状况的晴雨表,实时监控数据库性能
发布时间: 2024-07-23 03:57:55 阅读量: 73 订阅数: 26 

# 1. SQL Server 2008 性能监视器的概述**
SQL Server 2008 性能监视器是一个强大的工具,可用于监控和分析 SQL Server 实例的性能。它提供了一个全面的性能指标集合,涵盖服务器、数据库、连接和资源使用情况等各个方面。通过使用性能监视器,数据库管理员可以识别性能瓶颈、优化查询并确保数据库系统的平稳运行。
性能监视器收集的指标分为两类:服务器级指标和数据库级指标。服务器级指标反映整个 SQL Server 实例的性能,而数据库级指标则提供有关特定数据库的详细信息。这些指标可以进一步细分为子类别,例如服务器活动、会话统计信息、锁和死锁,以及数据库活动、事务日志和文件 I/O。
# 2. 性能监视器指标的分类和解读
性能监视器提供了一系列指标,用于衡量 SQL Server 实例的各个方面的性能。这些指标按层次结构组织,分为服务器级和数据库级。
### 2.1 服务器级指标
服务器级指标提供有关整个 SQL Server 实例的性能的信息。它们分为以下类别:
#### 2.1.1 服务器活动
* **批处理请求/秒:**每秒处理的批处理请求数。
* **连接:**当前连接到实例的客户端连接数。
* **用户连接:**当前连接到实例的活动用户连接数。
* **SQL 编译:**每秒编译的 SQL 语句数。
* **SQL 重编译:**每秒重新编译的 SQL 语句数。
#### 2.1.2 会话统计信息
* **会话:**当前活动的会话数。
* **会话时间:**会话的平均持续时间。
* **会话超时:**由于会话超时而终止的会话数。
* **会话死锁:**由于死锁而终止的会话数。
#### 2.1.3 锁和死锁
* **锁等待时间:**会话等待锁的平均时间。
* **锁等待次数:**会话等待锁的平均次数。
* **死锁:**每秒发生的死锁数。
### 2.2 数据库级指标
数据库级指标提供有关特定数据库的性能的信息。它们分为以下类别:
#### 2.2.1 数据库活动
* **批处理请求/秒:**每秒处理的批处理请求数。
* **连接:**当前连接到数据库的客户端连接数。
* **用户连接:**当前连接到数据库的活动用户连接数。
* **SQL 编译:**每秒编译的 SQL 语句数。
* **SQL 重编译:**每秒重新编译的 SQL 语句数。
#### 2.2.2 事务日志
* **日志写入速度:**每秒写入事务日志的字节数。
* **日志读取速度:**每秒从事务日志读取的字节数。
* **日志缓冲区命中率:**从日志缓冲区中读取日志页的命中率。
* **日志缓冲区写入延迟:**将日志页写入日志缓冲区的平均延迟。
#### 2.2.3 文件 I/O
* **物理读:**每秒从磁盘读取的物理页数。
* **逻辑读:**每秒从缓冲池读取的逻辑页数。
* **物理写:**每秒写入磁盘的物理页数。
* **逻辑写:**每秒写入缓冲池的逻辑页数。
**表格 2.1:服务器级和数据库级指标类别**
| 类别 | 服务器级 | 数据库级 |
|---|---|---|
| 服务器活动 | 是 | 否 |
| 会话统计信息 | 是 | 否 |
| 锁和死锁 | 是 | 否 |
| 数据库活动 | 否 | 是 |
| 事务日志 | 否 | 是 |
| 文件 I/O | 否 | 是 |
**图 2.1:性能监视器指标层次结构**
```mermaid
graph LR
subgraph 服务器级
A[服务器活动]
B[会话统计信息]
C[锁和死锁]
end
subgraph 数据库级
D[数据库活动]
E[事务日志]
F[文件 I/O]
end
A --> D
B --> D
C --> D
```
# 3. 性能监视器工具的使用
### 3.1 性能监视器控制台
#### 3.1.1 创建和管理数据收集器集
**操作步骤:**
1. 打开性能监视器控制台。
2. 在“数据收集器集”节点上右键单击,然后选择“新建”>“数据收集器集”。
3. 在“名称”字段中输入数据收集器集的名称。
4. 在“描述”字段中输入数据收集器集的描述(可选)。
5. 单击“添加”按钮添加要收集数据的性能计数器。
6. 在“添加计数器”对话框中,选择要收集数据的计算机和性能对象。
7. 选择要收集的特定性能计数器。
8. 设置要收集数据的采样间隔。
9. 单击“确定”按钮。
10. 单击“启动”按钮开始收集数据。
**参数说明:**
* **名称:**数据收集器集的唯一标识符。
* **描述:**数据收集器集的可选描述。
* **计算机:**要收集数据的计算机的名称

 百万级
高质量VIP文章无限畅学
百万级
高质量VIP文章无限畅学
 千万级
优质资源任意下载
千万级
优质资源任意下载
 C知道
免费提问 ( 生成式Al产品 )
C知道
免费提问 ( 生成式Al产品 )
0
0
相关推荐

专栏简介
《SQL Server 2008 数据库可疑》专栏深入探讨了 SQL Server 2008 数据库的安全、性能和优化方面。它提供了全面的指南,涵盖了可疑活动检测、性能优化、索引优化、查询优化、锁机制、备份和恢复策略、日志分析、性能监视、数据类型选择、存储过程和函数、触发器、视图和索引视图、安全性配置、权限管理、审核和合规性、故障转移群集配置、复制技术和日志传送配置。通过这些文章,读者可以了解 SQL Server 2008 数据库的复杂性,并获得优化其安全、性能和效率所需的知识和技能。
专栏目录
最低0.47元/天 解锁专栏
买1年送3月
百万级
高质量VIP文章无限畅学
千万级
优质资源任意下载
C知道
免费提问 ( 生成式Al产品 )
最新推荐
西门子V90 PN伺服进阶配置:FB284功能库高级应用技巧

# 摘要
本文全面介绍了西门子V90 PN伺服的基础知识,并深入讲解了FB284功能库的概述、安装、配置、参数设置、优化以及高级应用。通过详细阐述FB284功能库的安装要求、初始配置、参数设置技巧、功能块应用和调试故障诊断,本文旨在提供一个关于如何有效利用该功能库以满足自动化项目需求的实践指南。此外,本文通
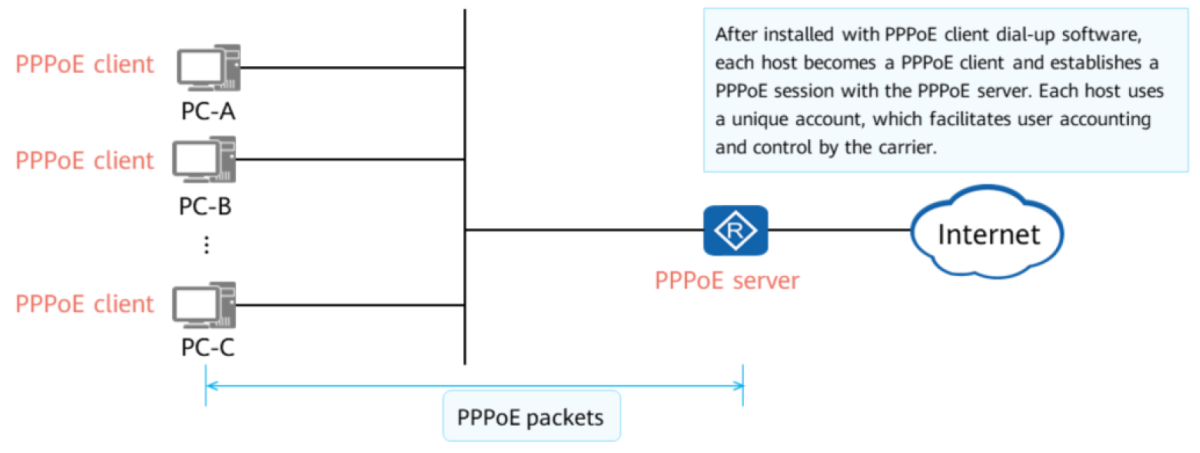
【Ensp网络实验新手必读】:7步快速搭建PPPoE实验环境
# 摘要
本文系统地介绍了网络基础知识,重点对PPPoE(点对点协议上以太网)技术进行了深入解析,从其工作原理、优势、应用场景以及认证机制等方面进行了全面阐述。同时,介绍了如何利用Ensp(Enterprise Simulation Platform,企业模拟平台)环境搭建和配置PPPoE服务器,并通过实验案例详细演示了PPPoE的
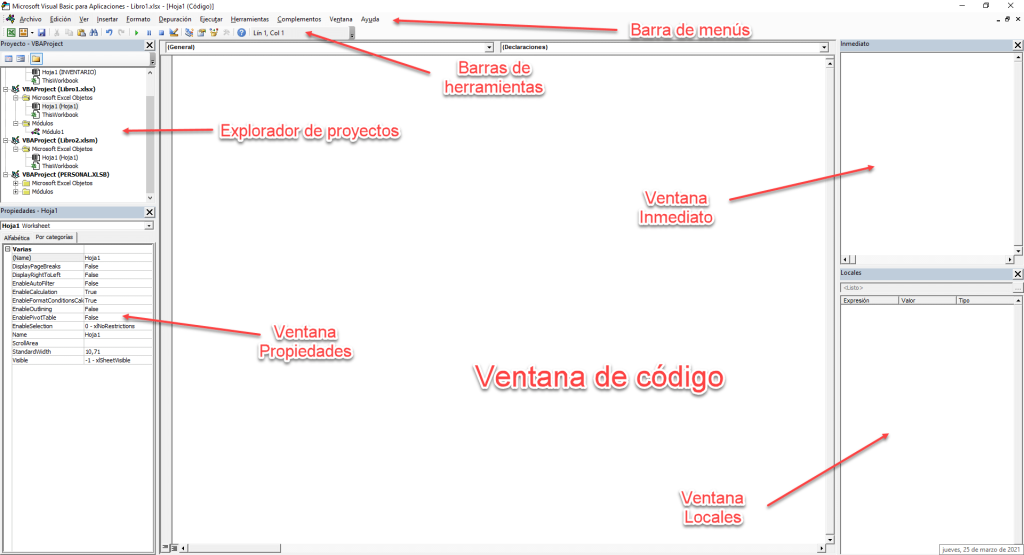
【Excel宏自动化终极指南】:打造你的第一个宏并优化性能
# 摘要
Excel宏自动化作为一种提高工作效率的技术,允许用户通过编写代码来自动化重复性任务和复杂的数据处理。本文全面介绍了Excel宏的基础知识,包括VBA编程基础和Excel对象模型的理解。通过创建和调试宏的实践经验,本文进一步展示了如何编写、优化和维护高效且安全的宏。此外,本文也探讨了宏在实际应用案例中的作用,包括自动化日常任务、数据分析和用户交互等方面
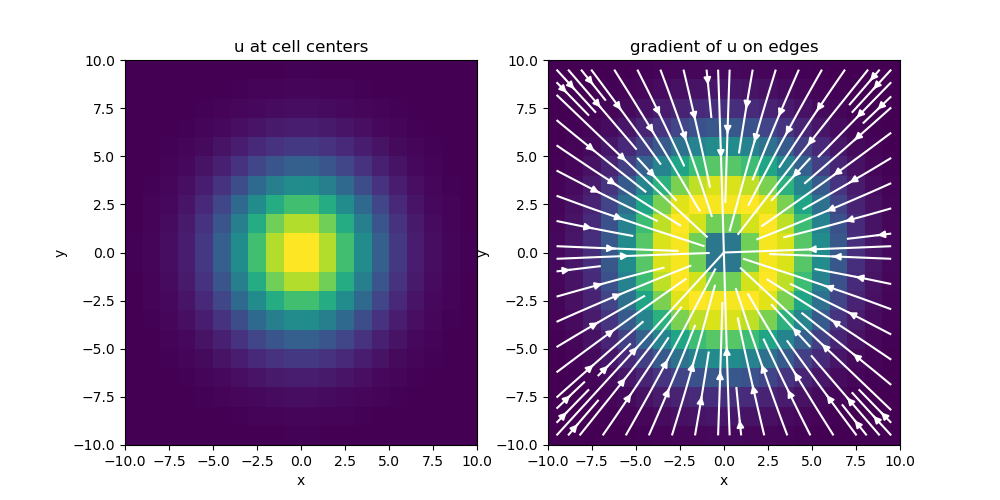
【多尺度可视化方法】:三维标量场数据的精细展现策略
# 摘要
多尺度可视化作为一种复杂数据的表示和分析方法,在三维标量场数据的处理和展示中发挥着重要作用。本文首先概述了多尺度可视化的基本理论与三维标量场数据的特点。随后,深入探讨了多尺度可视化技术的实现方法,包括数据预处理、可视化算法原理及其应用,以及交互式可视化的用户交互设计。接着,通过案例分析,展示了大数据集多尺度可视化和实时三维标量场数据展示的具体应用。最后,本文分析了多尺度
IAR EWARM调试秘籍:代码效率与稳定性提升技巧

# 摘要
IAR Embedded Workbench是嵌入式系统开发者广泛使用的集成开发环境。本文介绍了IAR Embedded Workbench的基本概况及其安装过程,接着深入探讨了代码效率优化的策略,包括高级编译器优化技术的应用、代码剖析与性能分析技巧,以及低功耗编程的实践方法。之后,文章专注于调试技巧,讨论了调试环境的设置
【JFreeChart:定制化图表开发的高级技巧】

# 摘要
JFreeChart是一个功能强大的Java图表库,它允许开发者在各种环境下创建和定制高质量的图表。本文首先介绍JFreeChart库的基础知识,包括基本图表对象的创建、数据源管理、图表元素的样式定制以及轴和坐标系统的定制。然后,深入探讨如何构建复杂的图表表示、交互式元素增强以及图表的性能优化
【Python地震数据分析】:obspy库的深入应用与性能优化

# 摘要
Python已成为地震数据分析领域的首选编程语言,而obspy库作为其核心工具之一,在地震数据采集、处理、分析及可视化方面提供了强大的支持。本文首先概述了Python在地震数据分析中的应用,随后深入探讨了obspy库的理论基础、核
保护数据完整性:电子秤协议安全机制的全面探讨

# 摘要
数据完整性与电子秤协议是确保交易准确性和安全性的重要基础。本文首先探讨了数据完整性的概念及其与数据安全的紧密联系,然后分析了电子秤协议的国际标准化组织规范及安全目标。在理论框架的基础上,进一步阐述了电子秤协议安全技术实现的多种方法,包括认证授权机制、加密技术应用以及传输层保护和数据校验。通过实践案例分析,总结了成功与失败案例中的安全
【TRS WAS 5.0负载均衡进阶教程】:提升系统扩展性的秘诀

# 摘要
本文旨在全面介绍TRS WAS 5.0的基础配置及其在负载均衡方面的应用。首先,我们从TRS WAS 5.0的基本概念和基础配置入手,为读者提供了系统配置的第一手经验。接着,深入探讨了负载均衡的理论基础、主要技术与算法,强调了调度策略、健康检查机制和会话保持的重要性。文章进一步通过实践部署章节,详细说明了在TRS WAS 5.0环境中如何配置集群以及实施负载均衡策略,包
资源上传下载、课程学习等过程中有任何疑问或建议,欢迎提出宝贵意见哦~我们会及时处理!
点击此处反馈


专栏目录
最低0.47元/天 解锁专栏
买1年送3月
百万级
高质量VIP文章无限畅学
千万级
优质资源任意下载
C知道
免费提问 ( 生成式Al产品 )