饼状图最佳实践指南:遵循原则,绘制美观且有效的饼状图
发布时间: 2024-07-11 06:17:11 阅读量: 146 订阅数: 34 
# 1. 饼状图的基础知识**
饼状图是一种圆形图表,用于展示数据分布。它将数据点表示为饼状图的一部分,其中每个部分的大小与数据点在数据集中的比例成正比。饼状图对于快速可视化数据分布很有用,但需要注意一些最佳实践以确保其有效性和可读性。
# 2. 饼状图设计原则**
**2.1 限制饼状图中的数据点数量**
饼状图最常见的错误之一是包含太多数据点。当饼状图中包含超过 7 个数据点时,它会变得难以阅读和理解。这是因为每个数据点的扇形面积会变小,标签会变得难以放置。
为了避免这种情况,请将饼状图中的数据点数量限制在 5 到 7 个。如果需要显示更多数据,请考虑使用其他图表类型,例如条形图或折线图。
**2.2 使用清晰且一致的颜色**
饼状图中使用的颜色应清晰且一致。避免使用太亮的或太暗的颜色,因为它们会难以看清。此外,请确保为每个数据点使用不同的颜色,以便轻松区分它们。
可以使用对比度检查器来确保所选颜色具有足够的对比度。
**代码块:**
```python
import matplotlib.pyplot as plt
# 创建饼状图
plt.pie([10, 20, 30, 40, 50], labels=['A', 'B', 'C', 'D', 'E'], colors=['red', 'green', 'blue', 'yellow', 'purple'])
# 显示饼状图
plt.show()
```
**逻辑分析:**
此代码块使用 matplotlib 库创建饼状图。它将数据点 [10, 20, 30, 40, 50] 绘制为扇形,并使用 ['A', 'B', 'C', 'D', 'E'] 作为标签。颜色参数指定了每个扇形的颜色。
**2.3 避免使用 3D 效果**
3D 效果会使饼状图难以阅读和理解。这是因为它们会创建阴影和透视,这会扭曲数据点的感知大小。
始终使用 2D 饼状图。它们更易于阅读和理解,并且可以更准确地表示数据。
**2.4 考虑使用其他图表类型**
在某些情况下,饼状图可能不是显示数据的最佳图表类型。例如,如果需要显示时间序列数据,则折线图可能是一个更好的选择。如果需要比较不同类别,则条形图可能是一个更好的选择。
在选择图表类型时,请考虑以下因素:
* 数据类型
* 要显示的信息
* 受众
通过考虑这些因素,您可以选择最能有效传达数据的图表类型。
# 3.1 使用饼状图展示数据分布
饼状图最常见的用途之一是展示数据分布。通过将每个类别的大小表示为饼状图中的一块,可以轻松可视化不同类别在总体中的占比。
**步骤:**
1. **收集数据:**收集要可视化的数据,确保数据是分类的,并且每个类别都有一个值。
2. **创建饼状图:**使用图表工具(例如 Microsoft Excel、Google Sheets 或 Tableau)创建饼状图。
3. **配置饼状图:**设置饼状图的标题、标签和颜色。确保颜色与类别相关,并且易于区分。
4. **解释饼状图:**分析饼状图,识别每个类别的大小和分布。使用标签和注释提供额外的上下文信息。
**示例:**
假设我们有以下数据,表示不同部门在公司总收入中的占比:
| 部门 | 收入 |
|---|---|
| 销售 | 40% |
| 营销 | 20% |
| 运营 | 25% |
| 研发 | 15% |
使用此数据,我们可以创建一个饼状图来可视化数据分布:
[Image of pie chart showing revenue distribution by department]
从饼状图中,我们可以清楚地看到销

 百万级
高质量VIP文章无限畅学
百万级
高质量VIP文章无限畅学
 千万级
优质资源任意下载
千万级
优质资源任意下载
 C知道
免费提问 ( 生成式Al产品 )
C知道
免费提问 ( 生成式Al产品 )
0
0
相关推荐

专栏简介
《饼状图绘制秘籍》专栏深入探讨了饼状图的绘制原理、进阶技巧、最佳实践和误区。它从基础知识开始,逐步指导读者掌握饼状图的绘制,并提供高级功能以提升数据可视化效果。专栏还比较了饼状图与其他图表,分析了饼状图在数据分析中的应用,以及在不同行业中的独特价值。此外,它还涵盖了动态可视化、跨平台兼容性、无障碍性、性能优化和协作编辑等方面的技巧,帮助读者创建美观且有效的饼状图。通过遵循本专栏的指南,读者可以从新手成长为饼状图绘制大师,并充分利用这一强大的数据可视化工具。
专栏目录
最低0.47元/天 解锁专栏
买1年送3月
百万级
高质量VIP文章无限畅学
千万级
优质资源任意下载
C知道
免费提问 ( 生成式Al产品 )
最新推荐
深入解析用例图
# 摘要
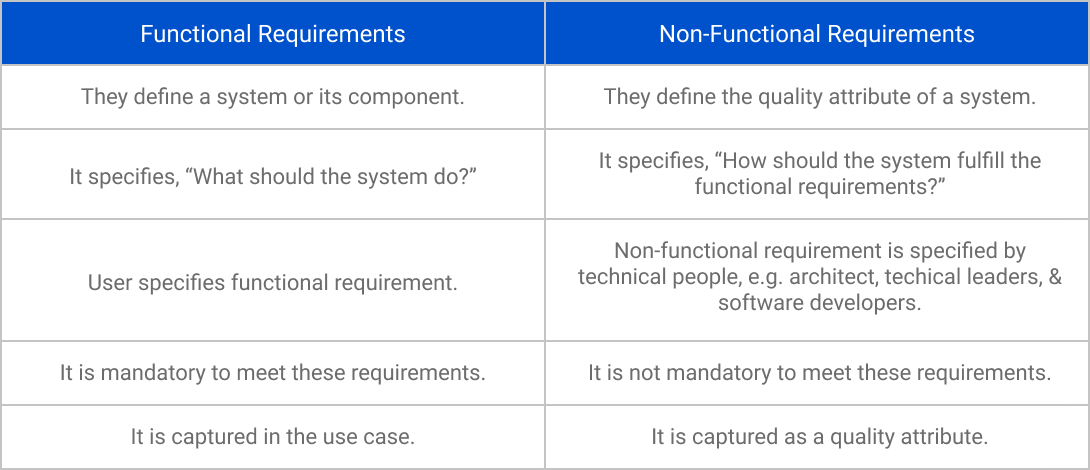
用例图是一种用于软件和系统工程中的图形化表示方法,它清晰地展示了系统的功能需求和参与者之间的交互。本文首先介绍了用例图的基础知识及其在软件工程中的重要作用,随后详细探讨了用例图的组成元素,包括参与者、用例以及它们之间的关系。文章深入分析了用例图的设计规则和最佳实践,强调了绘制过程中的关键步骤,如确定系统范围、识别元素和关系,以及遵循设计原则以保持图的简洁性、可读性和一致性。此外,本文还探讨了用例图在需求分析、系统设计以及敏捷开发中的应用,并通过案例分
IGMP v2报文在大型网络中的应用案例研究:揭秘网络优化的关键
# 摘要
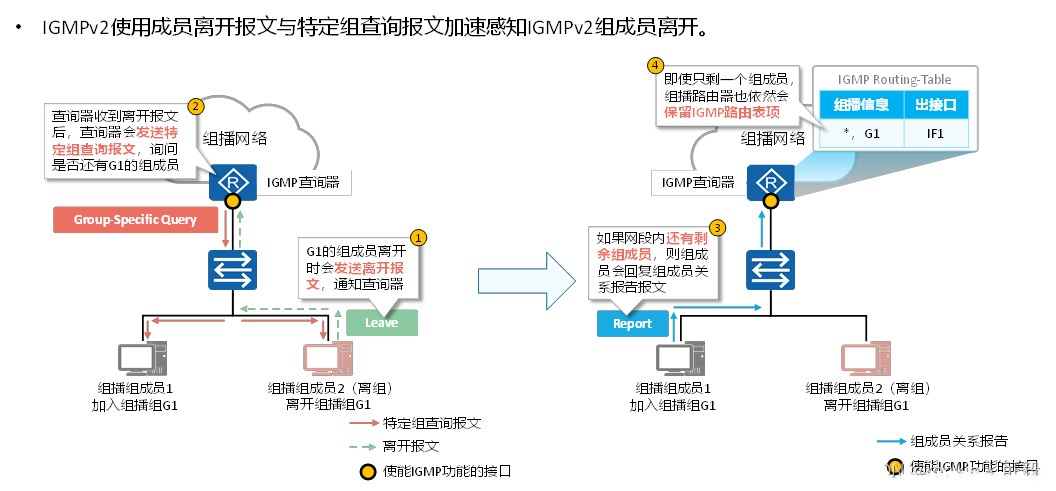
本文深入探讨了互联网组管理协议版本2(IGMP v2)的核心概念、报文结构、功能及其在大型网络中的应用。首先概述了IGMP v2协议的基本原理和报文类型,接着分析了其在网络中的关键作用,包括组成员关系的管理和组播流量的控制与优化。文中进一步探讨了在大型网络环境中如何有效地配置和应用IGMP v2,以及如何进行报文监控与故障排除。同时,本文也讨论了IGMP v
LTE网络优化基础指南:掌握核心技术与工具提升效率

# 摘要
本文旨在全面介绍LTE网络优化的概念及其重要性,并深入探讨其关键技术与理论基础。文章首先明确了LTE网络架构和组件,分析了无线通信原理,包括信号调制、MIMO技术和OFDMA/SC-FDMA等,随后介绍了性能指标和KPI的定义与评估方法。接着,文中详细讨论了LTE网络优化工具、网络覆盖与容量优化实践,以及网络故障诊断和问题解决策略。最后,本文展望了LTE网络的未来发展趋势,包括与5G的融合、新
艺术照明的革新:掌握Art-Net技术的7大核心优势
# 摘要
Art-Net作为一种先进的网络照明控制技术,其发展历程、理论基础、应用实践及优势展示构成了本文的研究核心。本文首先概述了Art-Net技术,随后深入分析了其理论基础,包括网络照明技术的演变、Art-Net协议架构及控制原理。第三章聚焦于Art-Net在艺术照明中的应用,从设计项目到场景创造,再到系统的调试与维护,详尽介绍了艺术照
【ANSYS网格划分详解】:一文掌握网格质量与仿真的秘密关系

# 摘要
ANSYS作为一款强大的工程仿真软件,其网格划分技术在保证仿真精度与效率方面发挥着关键作用。本文系统地介绍了ANSYS网格划分的基础知识、不同网格类型的选择依据以及尺寸和密度对仿真结果的影响。进一步,文章探讨了高级网格划分技术,包括自适应网
【STAR-CCM+网格划分进阶】:非流线型表面处理技术核心解析
# 摘要
本文对STAR-CCM+软件中的网格划分技术进行了全面的介绍,重点探讨了针对非流线型表面的网格类型选择及其特点、挑战,并提供了实操技巧和案例研究。文章首先介绍了网格划分的基础知识,包括不同类型的网格(结构化、非结构化、混合网格)及其应用。随后,深入分析了非流线型表面的特性,以及在网格划分过程中可能遇到的问题,并探讨了高级网格技术如局部加密与细化。实
【智能车竞赛秘籍】:气垫船控制系统架构深度剖析及故障快速修复技巧

# 摘要
气垫船作为一种先进的水上交通工具,其控制系统的设计与实现对于性能和安全性至关重要。本文首先概述了气垫船控制系统的基础理论,接着详细分析了硬件组成及其交互原理,包括动力系统的协同工作、传感器应用以及通信与数据链路的安全机制。第三章深入探讨了气垫船软件架构的设计,涵盖了实时操作系统的配置、控制算法的实现以及软件测试与验证。故障诊断与快速修复技术在第四章被讨论,提供了
Java网络编程必备:TongHTP2.0从入门到精通的全攻略

# 摘要
随着网络技术的快速发展,Java网络编程在企业级应用中占据了重要地位。本文首先介绍了Java网络编程的基础知识,然后深入探讨了HTTP协议的核心原理、不同版本的特性以及工作方式。文章进一步阐释了TongHTTP2.0的安装、配置、客户端和服务器端开发的具体操作。在高级应用部分,本文详细讲解了如何在TongHTTP2.0中集成SSL/TLS以实现安全通信,如何优化性
【LabVIEW编程:电子琴设计全攻略】:从零开始到精通,掌握LabVIEW电子琴设计的终极秘诀
# 摘要
本文系统介绍了LabVIEW编程在信号处理、图形用户界面设计以及电子琴项目中的应用。首先,阐述了LabVIEW编程基础和信号处理的基本知识,包括数字信号的生成、采样与量化,以及声音合成技术和数字滤波器设计。接着,深入探讨了LabVIEW编程图形用户界面的设计原则,交互式元素的实现以及响应式和自适应设计方法。最后,通过LabVIEW电子琴项目实战,分析
资源上传下载、课程学习等过程中有任何疑问或建议,欢迎提出宝贵意见哦~我们会及时处理!
点击此处反馈


专栏目录
最低0.47元/天 解锁专栏
买1年送3月
百万级
高质量VIP文章无限畅学
千万级
优质资源任意下载
C知道
免费提问 ( 生成式Al产品 )