SQL Server报表服务:生成交互式报告,让你的数据更直观
发布时间: 2024-07-23 09:45:04 阅读量: 48 订阅数: 22 

# 1. SQL Server报表服务的概述**
SQL Server报表服务(SSRS)是一个强大的平台,用于创建、部署和管理交互式报表。它使组织能够从各种数据源中提取数据,并将其呈现为易于理解的格式,从而支持数据驱动的决策。
SSRS 提供了丰富的功能,包括:
- **交互式报表:**允许用户通过参数、筛选器和钻取功能与报表进行交互,从而获得个性化的体验。
- **多种数据源支持:**可连接到各种数据源,包括关系数据库、多维数据集和云服务。
- **报表设计器:**直观的报表设计器简化了报表创建过程,允许用户使用拖放界面和报表定义语言 (RDL) 来设计报表。
# 2. 报表服务的基本架构和组件
### 2.1 报表服务器和报表管理器
**报表服务器**是报表服务的主要组件,它负责处理报表请求、生成报表并将其呈现给用户。报表服务器可以安装在单独的服务器上,也可以与 SQL Server 数据库引擎一起安装。
**报表管理器**是一个 Web 应用程序,它允许用户管理报表服务器、创建和管理报表、以及查看和导出报表。报表管理器还提供了一个用于创建和管理报表订阅的界面。
### 2.2 数据源和数据集
**数据源**是报表中数据的位置。报表服务支持各种数据源,包括 SQL Server 数据库、Oracle 数据库、MySQL 数据库和 XML 文件。
**数据集**是报表中数据的集合。数据集基于数据源创建,并用于在报表中填充数据。数据集可以包含来自多个数据源的数据,并可以通过过滤、排序和分组进行自定义。
### 2.3 报表设计器和报表定义语言 (RDL)
**报表设计器**是一个可视化工具,用于创建和修改报表。报表设计器提供了一个拖放界面,允许用户轻松添加和配置报表元素,例如文本框、图像和图表。
**报表定义语言 (RDL)**是一种 XML 语言,用于定义报表布局和内容。RDL 文件包含报表设计器中创建的报表的所有信息。
**代码块 1:创建数据集的示例 RDL 代码**
```xml
<DataSet Name="SalesDataSet">
<Fields>
<Field Name="ProductID">
<DataType>Int32</DataType>
</Field>
<Field Name="ProductName">
<DataType>String</DataType>
</Field>
<Field Name="UnitPrice">
<DataType>Decimal</DataType>
</Field>
</Fields>
<Query>
<CommandText>SELECT ProductID, ProductName,
```

 百万级
高质量VIP文章无限畅学
百万级
高质量VIP文章无限畅学
 千万级
优质资源任意下载
千万级
优质资源任意下载
 C知道
免费提问 ( 生成式Al产品 )
C知道
免费提问 ( 生成式Al产品 )
0
0
相关推荐

专栏简介
《数据库原理与 SQL Server 应用》专栏深入探讨了 SQL Server 数据库管理系统的方方面面。从数据库设计秘籍到索引优化技巧,再到事务处理和锁机制解析,本专栏提供了全面的指南,帮助您打造高性能、可扩展且可靠的数据库。此外,专栏还涵盖了存储过程、函数、触发器和约束,以提升代码可重用性并维护数据完整性。备份与恢复、性能监控与调优以及高可用性与灾难恢复等主题确保了数据的安全和业务连续性。通过并行查询处理、内存优化技术、表分区和数据分发,本专栏展示了如何管理海量数据并提升查询性能。全文搜索引擎、报表服务、集成服务和数据挖掘等高级功能进一步增强了 SQL Server 的功能,使其成为一个强大的数据管理和分析工具。
专栏目录
最低0.47元/天 解锁专栏
买1年送3月
百万级
高质量VIP文章无限畅学
千万级
优质资源任意下载
C知道
免费提问 ( 生成式Al产品 )
最新推荐
【MPU6050数据处理秘籍】:6大技巧提升动作捕捉和姿态估算精准度
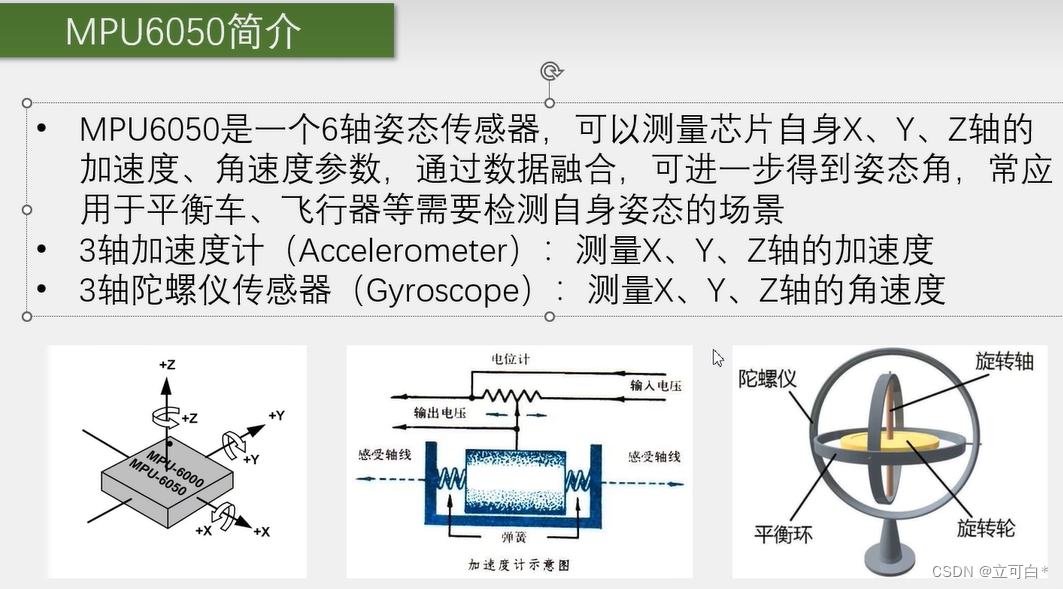
# 摘要
本文全面介绍了MPU6050传感器的基础知识和应用技术,详细探讨了其初始化、校准、数据读取与初步处理方法。文章深入阐述了动作捕捉技术的进阶应用,包括加速度和陀螺仪数据的融合、姿态解算,以及实时系统构建。同时,本论文着重分析了姿态估算的优化策略,包含数据处理、算法优化和错误检测。此外,本文还展示了MPU6050在智能穿戴、虚拟现实和工业机器人等不同领域的应用案例,并对其未来发展趋势和研究方向进行了展望。
【DS-7804N-K1性能提升指南】:一步到位实现监控系统性能飞跃
# 摘要
随着信息技术的快速发展,监控系统在性能提升方面扮演着至关重要的角色。本文首先概述了监控系统性能提升的重要性,随后深入探讨了其核心理论基础,包括性能监控的目标与方法、系统瓶颈分析以及资源管理策略。文章进一步针对DS-7804N-K1硬件优化实践进行了具体分析,涵盖了硬件升级、存储系统优化以及网络设备与带宽管理。在软件方面,分析了软件架构、
【激光打标机MD-X1000-1500秘籍全集】:从入门到精通的终极指南(20个必备技巧)

# 摘要
本文全面介绍了激光打标机MD-X1000-1500的基础知识、硬件组成、工作原理、操作设置、高级应用技巧以及软件应用和编程。文章首先阐述了激光打标机的基本构造和工作流程,随后详细讲解了硬件组件的功能及其交互,激光发生与调控机制,以及打标过程的技术原理。操作与设置章节则聚焦于如何有效地启动和预热设备、设置
【FANUC机器人:镜像备份与系统迁移无缝指南】

# 摘要
本文全面介绍了FANUC机器人系统的维护与优化流程,强调了准备工作与理论基础的重要性。文章从系统架构入手,详细阐述了镜像备份的原理、技术和实践操作,包括备份工具的选择、执行备份的步骤,以及遇到问题时的解决方案。同时,本文还深入探讨了系统迁移的实战演练,包括迁移前的准备工作、迁移过程详解和案例分析,以确保机器人系统的稳定和高效运行。最后,文章提
【Linux性能提升术】:iSecure Center运行效率的优化技巧
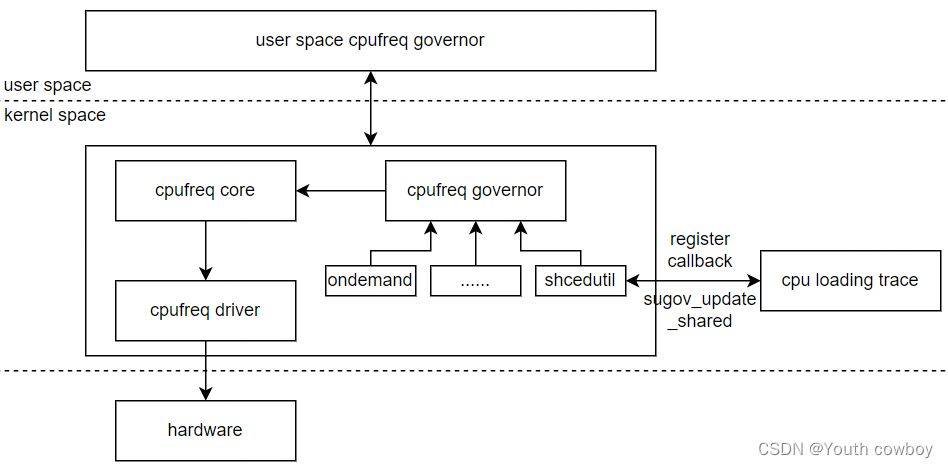
# 摘要
iSecure Center作为一个综合性能管理工具,在保障系统性能和优化配置方面发挥着关键作用。本文首先介绍了iSecure Center的基本概念及其性能基础,随后深入探讨了性能监控与分析技巧,涵盖监控工具选择、性能指标分析以及瓶颈诊断。第三章专注于iSecure Center的配置优化,分析了配置文件、系统资源调优以及安全性和性能之间的权衡。第四章讨论了
【Infoworks ICM与Hadoop协同】:大数据环境下的调度秘技!
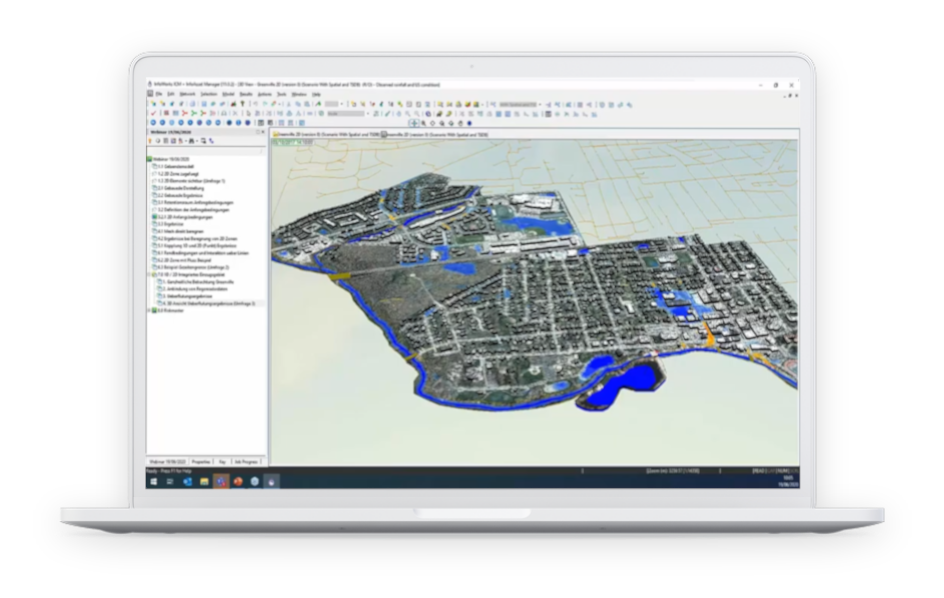
# 摘要
大数据环境下,调度系统是处理大规模数据集、实现高效数据处理的关键技术之一。本文首先对大数据调度环境进行了概览,接着介绍了Infoworks ICM平台的核心概念、架构、工作流程以及高级特性。文章深入探讨了Hadoop生态系统的核心组件和集成技术,提供了性能调优的策略和实践。进而,本文分析了Infoworks ICM与Hadoop的
Linux系统中JDK环境变量设置的完整流程:注意事项与高级技巧
# 摘要
本文全面介绍了JDK环境变量设置的基本概念、在Linux系统中的安装与配置方法、设置时的注意事项、实践案例、故障排查与维护,以及未来趋势与展望。重点探讨了在不同场景下如何正确配置JDK环境变量,确保开发和生产环境的顺畅运行。文章还提供了高级技巧,如使用别名和版本管理、自动化脚本的编写以及远程管理,旨在提高工作效率和环境的稳定性。此外,本文对JDK环境变量设置的故障排查进行了深入分析,并对新技术的影响和自动化部署的
汽车历史与文化术语:中英文对照及故事解读,汽车文化的传承者!

# 摘要
本文旨在提供一个全面的视角来探讨汽车的历史、技术、文化及其在现代社会的应用。通过回顾汽车的发展历程,分析中英文汽车术语的基础,本文深化了对汽车品牌、构造、技术和性能指标的认识。接着,文章深入解析汽车文化故事、赛事运动、设计艺术和收藏价值,以及汽车文化如何在全球范围内传播和在教育、后市场中的实践。此外,本文也关注了汽车术语在实战中的应用,并展望了汽车行业的未来趋势,包括法律规范
DVTK新版本功能深度剖析:掌握模拟精确度提升的十大关键特性
# 摘要
DVTK新版本在精确度提升方面取得显著进展,关键在于理论基础与技术实现的双重革新。本文概览了新版本的核心理论支持,包括模拟算法和理论模型的精确化,这些理论上的更新直接支撑了DVTK精确度的提升。技术实现方面,本版本优化了核心模拟引擎架构、增强了用户界面的直观性,以及改进了数据采集和处理流程,这些综合性的技术改进共同推动了DVTK精确度的
资源上传下载、课程学习等过程中有任何疑问或建议,欢迎提出宝贵意见哦~我们会及时处理!
点击此处反馈


专栏目录
最低0.47元/天 解锁专栏
买1年送3月
百万级
高质量VIP文章无限畅学
千万级
优质资源任意下载
C知道
免费提问 ( 生成式Al产品 )