MATLAB仿真在机器人技术中的应用:赋能智能机器的利器
发布时间: 2024-07-09 17:05:03 阅读量: 75 订阅数: 50 

用matlab仿真机器人系统
# 1. MATLAB简介**
MATLAB(Matrix Laboratory)是一种用于数值计算、可视化和编程的高级语言和交互式环境。它由 MathWorks 公司开发,广泛应用于科学、工程和金融等领域。MATLAB 以其强大的矩阵操作功能、丰富的工具箱和易于使用的图形用户界面而闻名。
MATLAB 的核心优势之一是其矩阵操作能力。它提供了一系列用于矩阵创建、操作和分析的函数。这些函数使研究人员和工程师能够高效地处理和分析大型数据集。此外,MATLAB 还提供了广泛的工具箱,涵盖了从信号处理到图像处理等各种领域。这些工具箱提供了预先构建的函数和算法,简化了复杂任务的实现。
# 2. MATLAB在机器人技术中的理论基础
### 2.1 机器人动力学和运动学建模
机器人动力学和运动学是机器人技术的基础,分别描述了机器人的运动特性和力学特性。
**机器人动力学**
机器人动力学描述了机器人的运动与作用在其上的力之间的关系。它涉及到牛顿第二定律和拉格朗日方程等基本物理原理。通过动力学建模,可以计算机器人的加速度、速度和位置等运动状态。
**机器人运动学**
机器人运动学描述了机器人的运动与关节变量之间的关系。它涉及到几何变换、齐次变换矩阵和欧拉角等数学工具。通过运动学建模,可以计算机器人的末端执行器的位姿和轨迹。
### 2.2 MATLAB中的机器人仿真建模
MATLAB提供了丰富的工具箱和函数库,可以方便地进行机器人仿真建模。
**机器人动力学仿真**
```matlab
% 创建机器人模型
robot = robotics.RigidBodyTree('DataFormat','column');
% 添加关节
joint1 = robotics.Joint('j1', 'revolute', 'X', [0, 0, 0]);
joint2 = robotics.Joint('j2', 'revolute', 'Y', [0, 0, 0]);
% 添加连杆
link1 = robotics.RigidBody('link1');
link2 = robotics.RigidBody('link2');
% 组装机器人
robot.addBody(link1, joint1);
robot.addBody(link2, joint2);
% 定义重力
gravity = [0; 0; -9.81];
% 定义关节角
q = [pi/4; pi/3];
% 计算机器人加速度
a = rigidBodyDynamics(robot, q, zeros(size(q)), gravity);
```
**机器人运动学仿真**
```matlab
% 创建机器人模型
robot = robotics.RigidBodyTree('DataFormat','column');
% 添加关节
joint1 = robotics.Joint('j1', 'revolute', 'X', [0, 0, 0]);
joint2 = robotics.Joint('j2', 'revolute', 'Y', [0, 0, 0]);
% 添加连杆
link1 = robotics.RigidBody('link1');
link2 = robotics.RigidBody('link2');
% 组装机器人
robot.addBody(link1, joint1);
robot.addBody(link2, joint2);
% 定义关节角
q = [pi/4; pi/3];
% 计算机器人末端执行器位姿
T = getTransform(robot, q, 'link2');
```
通过MATLAB中的仿真建模,可以直观地分析机器人运动的规律,并为机器人的控制和规划提供基础。
# 3.1 机器人轨迹规划和控制
### 轨迹规划
轨迹规划是指为机器人确定一条从起始位置到目标位置的路径,同时满足运动学和动力学约束。MATLAB中提供了丰富的工具箱和函数库,可以高效地完成机器人轨迹规划任务。
**基于样条曲线的轨迹规划**
样条曲线是一种分段多项式函数,可以平滑地连接一系列控制点。MATLAB中的`spline`函数可以生成样条曲线,并用于规划机器人的轨迹。
```matlab
% 定义控制点
control_points = [0, 0; 1, 1; 2, 2];
% 生成样条曲线
spline_curve = spline(control_points(:, 1), control_points(:, 2));
% 评估轨迹点
t = linspace(0, 1, 100); % 时间参数
trajectory = ppval(spline_curve, t);
```
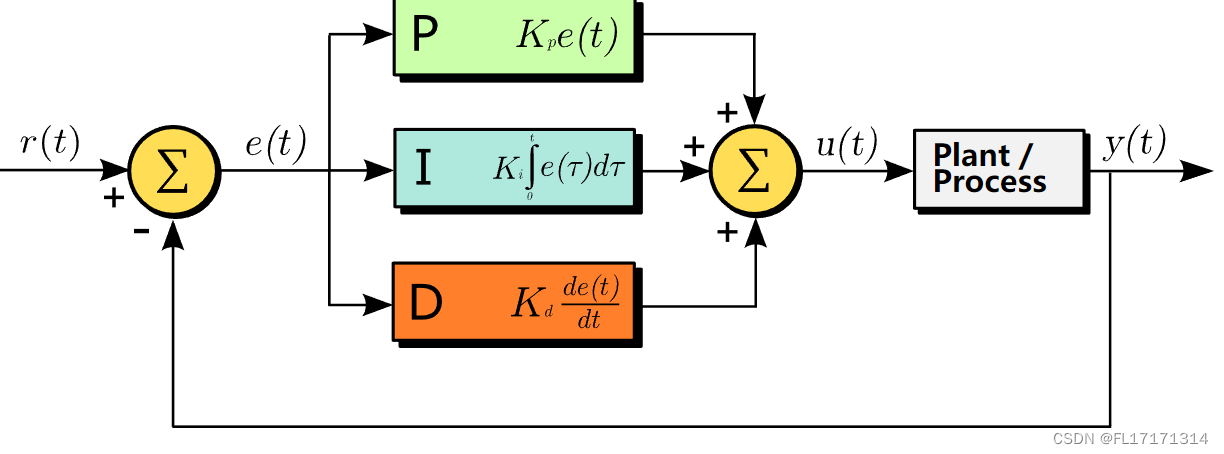
### 运动控制
运动控制是指根据轨迹规划的路径,控制机器人的运动,使其沿着路径平稳、准确地移动。MATLAB中提供了`controlSystemDesigner`工具箱,可以设计和仿真各种运动控制器

 百万级
高质量VIP文章无限畅学
百万级
高质量VIP文章无限畅学
 千万级
优质资源任意下载
千万级
优质资源任意下载
 C知道
免费提问 ( 生成式Al产品 )
C知道
免费提问 ( 生成式Al产品 )
0
0
相关推荐

专栏简介
本专栏深入探讨了 MATLAB 仿真技术,从入门秘籍到实战应用,涵盖了仿真背后的数学奥秘、建模技巧、结果分析、验证与验证指南。专栏还重点介绍了 MATLAB 仿真在各个领域的广泛应用,包括控制系统、通信系统、图像处理、医学成像、生物医学工程、汽车工程、机器人技术、能源系统和教育。通过深入浅出的讲解和丰富的案例,本专栏旨在帮助读者掌握 MATLAB 仿真技术,解锁其在各个领域的强大潜力,推动创新和解决实际问题。
专栏目录
最低0.47元/天 解锁专栏
买1年送3月
百万级
高质量VIP文章无限畅学
千万级
优质资源任意下载
C知道
免费提问 ( 生成式Al产品 )
最新推荐
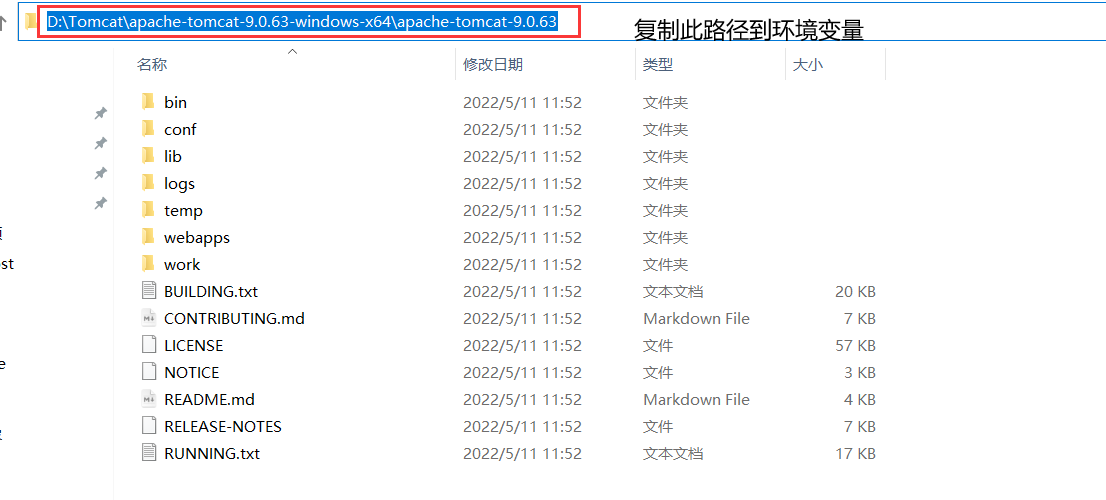
【Tomcat根目录优化指南】:一文掌握部署效率与性能提升的终极策略
# 摘要
本文对Tomcat服务器的部署优化进行了全面的研究,从理论基础到实践应用,涵盖了目录结构、配置文件、部署策略、集群环境等关键领域。文章深入分析了Tomcat根目录的构成、性能影响及其优化方法,并探讨了应用程序部署时的性能考量。特别在集群环境下,本文提出了共享资源管理、负载均衡及故障转移的优化策略。通过案例研究与性能调优实例,本文展示了如何在高并发网站和大型电商平台中应用优化技术,并强调了持续监
UG Block安全与兼容性:一文掌握保护与跨平台运行技巧
# 摘要
UG Block作为一种技术方案,在多个领域中具有广泛应用。本文系统地介绍了UG Block的基本概念、安全机制、运行技巧、高级安全特性以及安全监控与管理。首先,概述了UG Block的基本概念和安全策略,然后深入探讨了在不同平台下的运行技巧,包括跨平台兼容性原理和性能优化。接着,分析了UG Block的高级安全特性,如加密技术、访问控制与身份验证以及安全审计与合规性。此外,还讨论了安全监控与
TIMESAT自动化部署秘籍:维护监控系统的高效之道
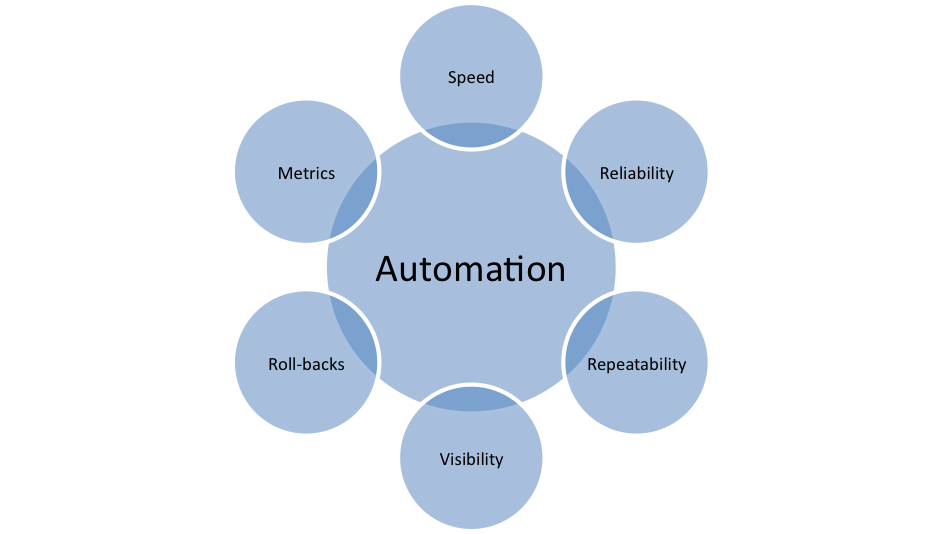
# 摘要
Timesat作为一个先进的自动化部署工具,在软件开发生命周期中扮演着关键角色,尤其在维护部署流程的效率和可靠性方面。本文首先概述了Timesat的功能及其在自动化部署中的应用,随后详细探讨了Timesat的工作原理、数据流处理机制以及自动化部署的基本概念和流程。通过实战技巧章节,文章揭示了Timesat配置、环境优化、脚本编写与执行的具体技巧,以及集成和监控的设置方法。在深入应用章节,介绍了Timesat的高级配置选
【SUSE Linux系统优化】:新手必学的15个最佳实践和安全设置
# 摘要
本文详细探讨了SUSE Linux系统的优化方法,涵盖了从基础系统配置到高级性能调优的各个方面。首先,概述了系统优化的重要性,随后详细介绍了基础系统优化实践,包括软件包管理、系统升级、服务管理以及性能监控工具的应用。接着,深入到存储与文件系统的优化,讲解了磁盘分区、挂载点管理、文件系统调整以及LVM逻辑卷的创建与管理。文章还强调了网络性能和安全优化,探讨了网络配置、防火墙设置、
【私密性】:揭秘行业内幕:如何将TI-LMP91000模块完美集成到任何系统

# 摘要
本论文全面介绍并深入分析了TI-
网络安全升级:GSP TBC在数据保护中的革命性应用

# 摘要
本论文旨在探讨网络安全与数据保护领域的GSP TBC技术。首先介绍了GSP TBC技术的起源与发展,以及其理论基础,包括数据加密、混淆技术和数据完整性校验机制等关键技术。随后,文章分析了GSP TBC在金融、电子商务和医疗保健等行业的实践应用,并探讨了在这些领域中保护金融交
深度解读NAFNet:图像去模糊技术的创新突破
# 摘要
图像去模糊技术是数字图像处理领域的重要课题,对于改善视觉效果和提升图像质量具有重要意义。本论文首先概述了图像去模糊技术的发展历程和当前的应用现状,随后深入探讨了NAFNet作为一项创新的图像去模糊技术,包括其数学原理、核心架构以及与传统去模糊技术的比较。NAFNet的核心架构和设计理念在提升图像清晰度和
【系统分析与设计】:单头线号检测技术的深度剖析
# 摘要
单头线号检测技术是一种专门用于自动化生产线的高效检测方法,它可以快速准确地识别产品上的线号,提高生产的效率和质量。本文首先概述了单头线号检测技术的基本理论基础,包括线号检测的原理与技术路线、单头线号检测系统的组成,以及影响检测性能的各种因素。接着,文章深入探讨了单头线号检测技术在工业中的实际应用,包括其在自动化生产线中的实施案例和性能评估,以及针对该技术的优化策
【算法设计高级应用】:电子科技大学李洪伟教授的复杂算法解题模板
# 摘要
算法设计与问题求解是计算机科学与工程的核心内容,本文首先介绍了算法设计的基础知识,随后深入探讨了数据结构与算法效率之间的关系,并分析了分治法、动态规划、贪心算法等高级算法设计模式的原理和应用。在特定领域应用章节中,本文详细论述了图论问题、网络流问题以及字符串处理和模式匹配问题的算法解决方案和优化策略。最后,通过实战演练与案例分析,将理论知识应用于解决复杂算法问题,同时对算法效率进行评
资源上传下载、课程学习等过程中有任何疑问或建议,欢迎提出宝贵意见哦~我们会及时处理!
点击此处反馈


专栏目录
最低0.47元/天 解锁专栏
买1年送3月
百万级
高质量VIP文章无限畅学
千万级
优质资源任意下载
C知道
免费提问 ( 生成式Al产品 )