图表布局与排版:刻画图表结构艺术
发布时间: 2024-02-22 05:26:49 阅读量: 42 订阅数: 29 
# 1. 图表设计基础
- 1.1 图表设计原则与要点
- 1.2 图表类型与用途分析
- 1.3 图表设计工具与软件介绍
```python
# 1.1 图表设计原则与要点
## 图表设计原则
图表设计的本质是为了清晰、准确地传达信息,因此在设计图表时,需要遵循以下原则:
- 简洁明了:图表应当简洁清晰,避免过多无关信息干扰读者。
- 准确性:图表所展示的数据应当准确无误,不偏不倚。
- 合适的图表类型:根据所要表达的数据类型选择合适的图表类型,比如折线图、饼图、柱状图等。
- 视觉引导:通过图表的布局、颜色、标签等元素引导读者关注重点,传达所要表达的信息。
## 图表设计要点
在进行图表设计时,需要重点关注以下几个要点:
- 数据清晰:数据清晰易懂,避免歧义,同时要注明数据来源和说明。
- 统一风格:保持图表的整体风格统一,包括颜色、字体、标签等方面。
- 足够的信息:图表需要包含足够的信息,但又不要过于拥挤。
- 可读性:保证图表在不同大小的屏幕上都能够清晰、明了地展示数据。
```
# 2. 图表布局与比例
图表布局与比例在图表设计中起着至关重要的作用,它不仅关乎图表的美观度,更关乎信息的清晰传达和用户的良好体验。本章将深入探讨图表布局与比例的原则与技巧,帮助读者更好地掌握图表的结构艺术。
#### 2.1 图表布局原则与规范
在进行图表设计时,良好的布局是十分重要的。合理的布局能够使图表更易读、更易理解,下面通过具体示例说明图表布局的原则与规范。
```python
# 示例:使用python的matplotlib库进行图表布局示例
import matplotlib.pyplot as plt
# 构造数据
labels = ['A', 'B', 'C', 'D']
sizes = [25, 30, 20, 25]
# 创建饼图
plt.pie(sizes, labels=labels, autopct='%1.1f%%')
# 设置布局
plt.axis('equal') # 使饼图长宽相等,呈圆形
plt.title('图表布局示例') # 设置标题
# 显示图表
plt.show()
```
**代码总结:** 通过matplotlib库创建了一个简单的饼图,并通过`plt.axis('equal')`设置了布局,使饼图呈圆形显示。
**结果说明:** 饼图呈现出圆形布局,符合良好的布局原则。
#### 2.2 图表比例选择与调整
图表的比例直接影响着信息的展示效果,选择合适的比例能够突出重点、凸显数据特点。下面针对柱状图的比例进行说明。
```java
// 示例:使用Java的JFreeChart库进行柱状图比例调整示例
import org.jfree.chart.ChartFactory;
import org.jfree.chart.ChartPanel;
import org.jfree.chart.JFreeChart;
import org.jfree.data.category.DefaultCategoryDataset;
// 构造数据集
DefaultCategoryDataset dataset = new DefaultCategoryDataset();
dataset.addValue(1, "Category 1", "A");
dataset.addValue(3, "Category 1", "B");
dataset.addValue(2, "Category 1", "C");
// 创建柱状图
JFreeChart barChart = ChartFactory.createBarChart("柱状图比例调整示例", "Category", "Value", dataset);
// 创建图表面板
ChartPanel chartPanel = new ChartPanel(barChart);
chartPanel.setPreferredSize(new java.awt.Dimension(560, 370));
// 添加图表面板到当前窗体
setContentPane(chartPanel);
```
**代码总结:** 使用JFreeChart库创建了一个简单的柱状图,并通过数据值的不同进行比例调整。
**结果说明:** 数据值为1、3、2的柱状图比例大小呈现出明显差异。
#### 2.3 图表与页面布局的协调性
图表在页面布局中也需要考虑与其他元素的协调性,下面以HTML、CSS为例进行页面布局与图表协调性的说明。
```html
<!-- 示例:使用HTML、CSS进行页面布局与图表协调性示例 -->
<!DOCTYPE html>
<html>
<head>
<style>
.chart-container {
width: 50%;
float: left;
}
.text-content {
width: 50%;
float: left;
}
</style>
</head>
<body>
<div class="chart-container">
<canvas id="myChart"></canvas>
</div>
<div class="text-content">
<h2>图表协调性示例</h2>
<p>这里是其他内容,与图表进行协调布局。</p>
</div>
<script>
// JavaScript代码,绘制图表
var ctx = document.get
```

 百万级
高质量VIP文章无限畅学
百万级
高质量VIP文章无限畅学
 千万级
优质资源任意下载
千万级
优质资源任意下载
 C知道
免费提问 ( 生成式Al产品 )
C知道
免费提问 ( 生成式Al产品 )
0
0
相关推荐

专栏简介
本专栏“Python数据可视化编程”旨在帮助读者掌握使用Python进行数据可视化的技能,从而更好地探索和呈现数据。文章涵盖了使用Seaborn库探索数据分布和关系,选择合适的图形类型进行数据可视化,展示时间序列数据的趋势与季节性,利用Geopandas绘制地理数据地图,创建交互式图表和仪表盘,以及对文本数据进行词云、主题模型和情感分析可视化。此外,还介绍了如何设计图表布局与排版,使得最终呈现的图表更具艺术性和易读性。通过学习本专栏,读者将能够掌握丰富的数据可视化技能,为数据分析和展示提供更有效的工具和方法。
最低0.47元/天 解锁专栏
买1年送3月
百万级
高质量VIP文章无限畅学
千万级
优质资源任意下载
C知道
免费提问 ( 生成式Al产品 )
最新推荐
【Cortex-M4内核初探】:一步到位掌握核心概念和特性(专家级解读)
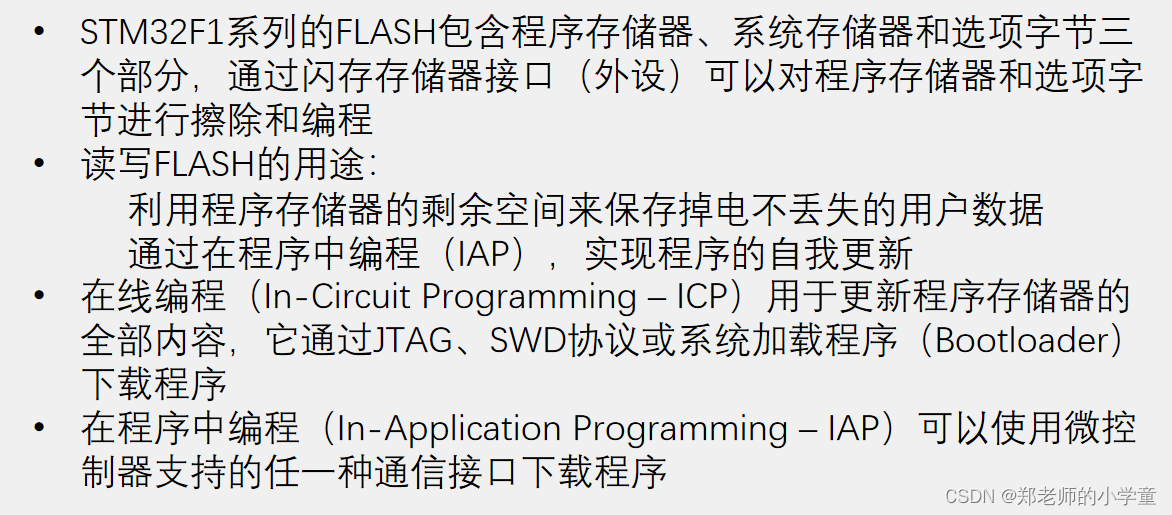
# 摘要
本文旨在全面介绍Cortex-M4内核的技术细节与实践应用。首先,对Cortex-M4内核的架构设计理念、执行模型与工作模式、指令集和编程模型进行了理论基础的阐述。随后,探讨了嵌入式系统开发环境的搭建、中断和异常处理机制以及性能优化技巧,这些实践应用部分着重于如何在实际项目中有效利用Cortex-M4内核特性。高级特性章节分析了单精度浮点单元(FPU)、调试和跟踪技术以及实时操作系统(RTOS)的集成,这些都是提
【终极攻略】:5大步骤确保Flash插件在各浏览器中完美兼容
# 摘要
随着网络技术的发展和浏览器的不断更新,Flash插件在现代网络中的地位经历了显著的变化。本文首先回顾了Flash插件的历史及其在现代网络中的应用,随后深入探讨了浏览器兼容性的基础知识点,并分析了Flash插件与浏览器之间的交互原理。文章详细介绍了确保Flash插件兼容性的理论与实践方法,包括配置、更新、诊断工具和用户权限设置。进一步,文章探讨了Flash插件在各主流浏览器中的具
【ABB机器人高级编程】:ITimer与中断处理的终极指南
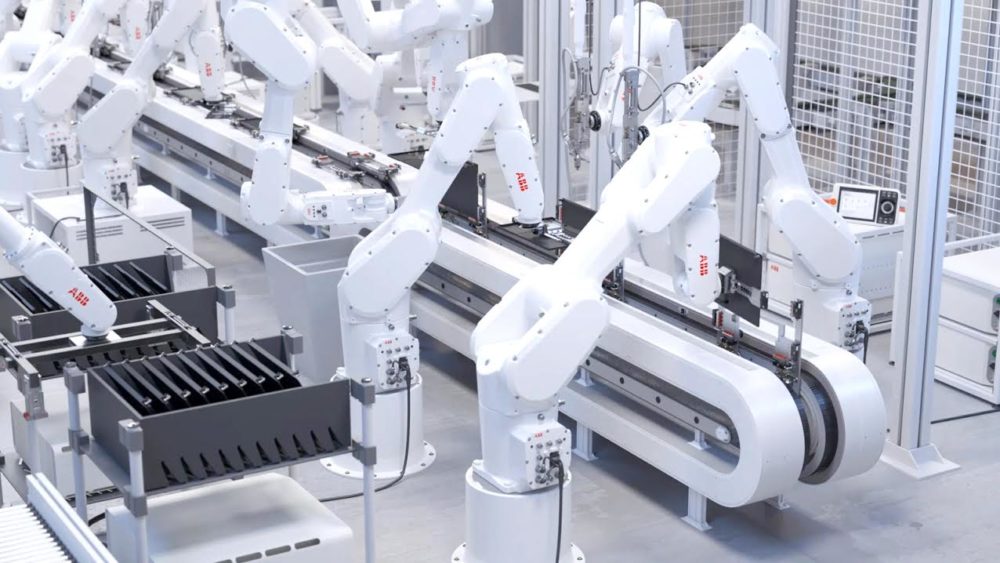
# 摘要
本文深入探讨了ABB机器人编程中ITimer的概念、工作原理及其应用,并详细阐述了中断处理的基础知识与在机器人中的实际应用。通过分析ITimer在不同场景下的应用技巧和集成方案,本文旨在提升机器人的任务调度效率与实时性。文章还涉及了如何通过ITimer实现高级中断处理技术,以及如何进行性能调试与优化。通过对实践案例的分析,本文揭示了集成ITimer与中断处理的挑战与解决策略
LabVIEW AKD驱动配置全攻略:手把手教你做调试

# 摘要
本文提供了对LabVIEW AKD驱动配置的全面介绍,涵盖了从基础知识理解到实际应用的各个阶段。首先,文章对AKD驱动的基本概念、作用以及其在LabVIEW中的角色进行了阐述。然后,详细介绍了驱动的安装步骤、配置方法和硬件连接校验的过程。此外,文章还深入探讨了调试、性能优化以及高级应用开发方面的技巧,包括驱动的自定义扩展和在复杂系统中的应用。
【Word表格边框问题速查手册】:10分钟内快速诊断与修复技巧
# 摘要
Word表格边框问题常见于文档编辑过程中,可能影响文档的整体美观和专业性。本文系统地介绍了表格边框的基础知识,提供了快速诊断边框问题的多种工具与方法,并分享了基础及高级的修复技巧。文章进一步探讨了如何通过优化边框设置和遵循表格设计最佳实践来预防边框问题的出现。最后,通过真实案例分析和经验分享,文章旨在为Word用户在处理表格边框问题时提供有效的指导和帮助,并展望了未来在Word技术更新与
触控屏性能革新:FT5216_FT5316数据手册深入解读与优化
# 摘要
本文从多个方面深入探讨了FT5216/FT5316触控屏控制器的技术细节,包括硬件架构、性能参数、集成模块、软件开发、调试及性能优化策略。首先介绍了FT5216/FT5316的技术概述和硬件特性,随后分析了软件开发环境和通信协议,重点在于如何通过驱动开发和调试来提高触控屏的性能表现。此外,本文还通过案例研究展示如何识别性能瓶颈,并提出针对性的优化方案,评估其实施效果。最后,展望了FT5216/FT5316的未来发展趋势,包括新兴技术的应用和市场定位,以及产品迭代升级的潜在方向。
# 关键字
触控屏技术;FT5216/FT5316;硬件特性;性能优化;软件开发;通信协议
参考资源链
【从零开始的TouchGFX v4.9.3图形界面构建】:案例分析与实践指南
# 摘要
本文详细介绍了TouchGFX图形界面的构建过程,涵盖了从基本配置到项目优化的各个方面。首先,文章概述了TouchGFX的基本配置和开发环境搭建,包括系统要求、工具链配置和项目结构解析。接着,重点介绍了图形界面的设计与实现,探讨了界面元素的设计、动画与交互效果的开发以及图形和图像处理技术。随后,文章
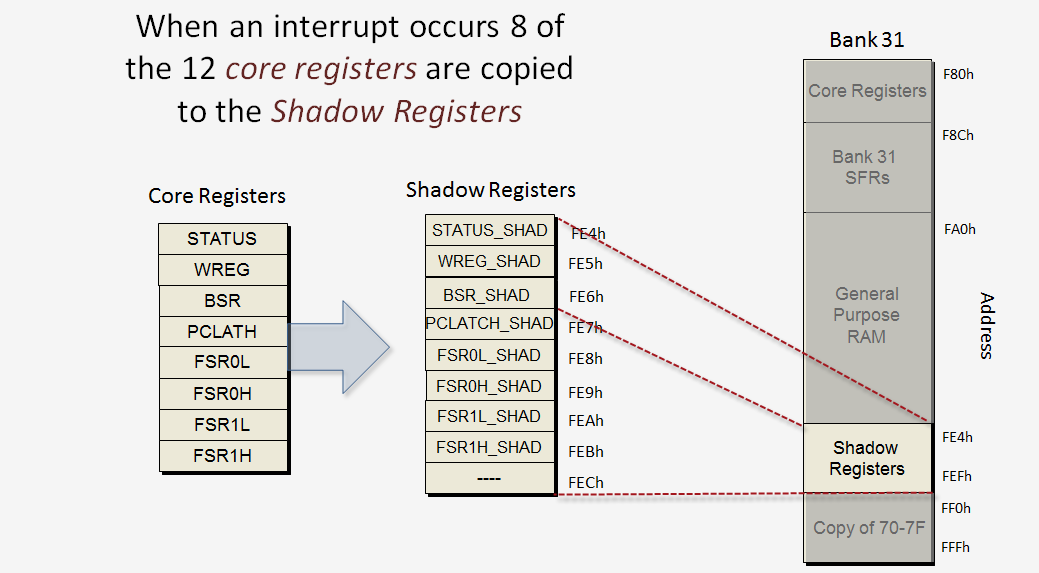
【TC397中断服务程序构建】:高效响应的从零到一
# 摘要
本文全面介绍了TC397中断服务程序,从基础理论到实际开发,再到进阶应用和未来展望进行了深入探讨。首先概述了TC397中断服务程序的基本概念,并详细阐释了其中断机制的原理、设计原则及编程模型。随后,文章针对开发实践提供了详细的环境搭建、代码编写、调试和性能优化指导。进一步地,文章分析了中断服务程序在复杂场景下的高级应用,包括中断嵌套管理、实时
资源上传下载、课程学习等过程中有任何疑问或建议,欢迎提出宝贵意见哦~我们会及时处理!
点击此处反馈


专栏目录

文章持续更新中,敬请期待~
最低0.47元/天 解锁专栏
买1年送3月
百万级
高质量VIP文章无限畅学
千万级
优质资源任意下载
C知道
免费提问 ( 生成式Al产品 )