OpenCV Python运动估计:分析图像序列中的运动,让你的视频分析更深入
发布时间: 2024-08-05 16:08:16 阅读量: 41 订阅数: 44 
# 1. OpenCV Python运动估计概述
**1.1 运动估计的定义和重要性**
运动估计是计算机视觉中一项关键技术,其目的是从图像序列中估计物体的运动。它在许多应用中至关重要,例如视频稳定、物体跟踪和动作识别。
**1.2 OpenCV Python中的运动估计**
OpenCV Python是一个功能强大的计算机视觉库,它提供了广泛的运动估计算法。这些算法可以分为两大类:光流法和特征匹配法。光流法基于图像像素的运动,而特征匹配法基于图像中特征点的运动。
# 2. 运动估计理论基础
运动估计是计算机视觉领域的重要任务,其目标是估计图像或视频序列中对象的运动。运动估计技术广泛应用于视频稳定、物体跟踪、行为识别等领域。本章节介绍运动估计的理论基础,包括光流法和特征匹配法。
### 2.1 光流法
光流法是一种基于图像像素灰度变化的运动估计方法。它假设图像中像素的灰度值在短时间内保持不变,因此可以利用相邻帧之间的灰度变化来估计像素的运动。
#### 2.1.1 光流方程
光流方程描述了图像中像素灰度值随时间变化与像素运动的关系:
```
I(x, y, t) = I(x + dx, y + dy, t + dt)
```
其中:
* `I(x, y, t)` 表示图像在时间 `t` 时刻坐标 `(x, y)` 处的像素灰度值。
* `dx` 和 `dy` 表示像素在时间 `dt` 内的水平和垂直位移。
通过对光流方程求偏导,可以得到光流方程的微分形式:
```
∂I/∂x * dx + ∂I/∂y * dy + ∂I/∂t * dt = 0
```
#### 2.1.2 光流算法
光流算法根据光流方程的不同求解方法分为基于梯度的方法和基于区域的方法。
**基于梯度的方法**:
* **Lucas-Kanade光流法:**利用图像梯度信息求解光流方程,假设图像局部区域的运动是平移的。
* **Farneback光流法:**采用多级金字塔和全局优化技术,提高光流估计的鲁棒性和准确性。
**基于区域的方法:**
* **块匹配法:**将图像划分为小块,然后匹配相邻帧中对应块的灰度值,以估计块的运动。
* **光学流法:**利用图像中局部区域的相似性,通过最小化相邻帧之间区域灰度值的差异来估计光流。
### 2.2 特征匹配法
特征匹配法是一种基于图像中特征点的运动估计方法。它首先检测和描述图像中的特征点,然后匹配相邻帧中的对应特征点,以估计特征点的运动。
#### 2.2.1 特征检测和描述
特征检测算法用于在图像中检测具有显著性的特征点,如角点、边缘点和斑点。常用的特征检测算法包括:
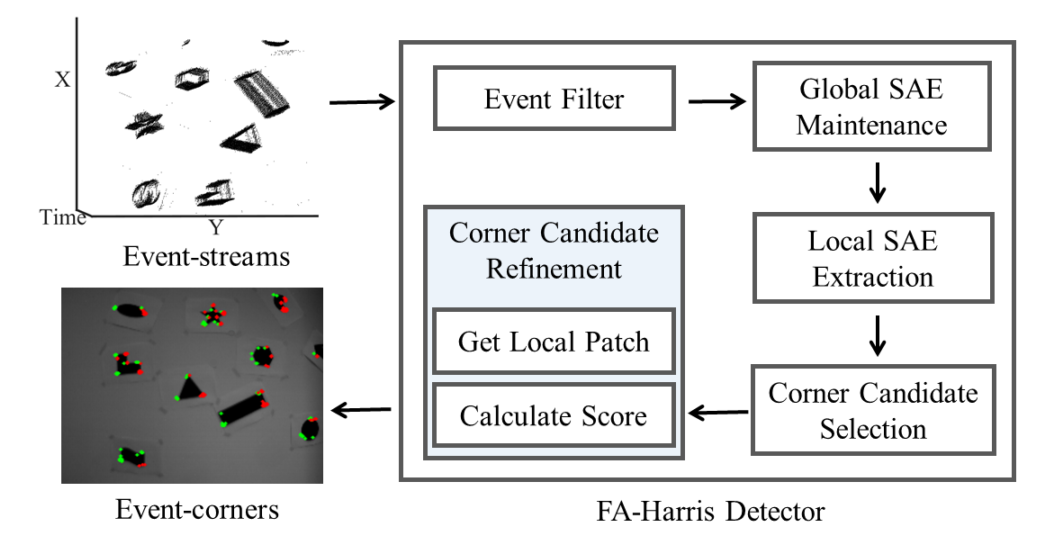
* **Harris角点检测器:**检测图像中具有较大梯度变化的角点。
* **SIFT算法:**检测图像中具有尺度不变性和旋转不变性的特征点。
* **ORB算法:**检测图像中具有快速计算和较好鲁棒性的特征点。
特征描述算法用于描述特征点的局部信息,以实现特征点的匹配。常用的特征描述算法包括:
* **SIFT描述符:**利用图像梯度信息生成特征点的直方图描述符。
* **ORB描述符:**利用图像二进制模式生成特征点的二进制描述符。
#### 2.2.2 特征匹配算法
特征匹配算法用于匹配相邻帧中的对应特征点。常用的特征匹配算法包括:
* **暴力匹配:**对所有特征点进行逐一匹配,计算特征描述符之间的距离。
* **近邻匹配:**对每个特征点,找到其在相邻帧中距离最近的特征点。
* **最近邻匹配与比率检验:**对每个特征点,找到其在相邻帧中距离最近和次近的特征点,并计算两者的距离比。如果距离比小于阈值,则认为特征点匹配成功。
# 3.1 光流法实现
光流法是运动估计中最常用的方法之一,它通过估计图像像素在连续帧之间的运动来计算光流场。OpenCV提供了两种光流算法的实现:Lucas-Kanade光流法和Farneback光流法。
#### 3.1.1 Lucas-Kanade光流法
Lucas-Kanade光流法是一种基于灰度不变性的光流算法。它假设图像像素在连续帧之间的灰度值保持不变,并使用泰勒级数展开来近似光流方程。
```python
import cv2
import numpy as np
# 读入图像
frame1 = cv2.imread('frame1.jpg')
frame2 = cv2.imread('frame2.jpg')
# 转换为灰度图像
gray1 = cv2.cvtColor(frame1, cv2.COLOR_BGR2GRAY)
gray2 = cv2.cvtColor(frame2, cv2.COLOR_BGR2GRAY)
# 计算光流
lk_params = dict(winSize=(15, 15),
maxLevel=2,
criteria=(cv2.TERM_CRITERIA_EPS | cv2.TERM_CRITERIA_COUNT, 10, 0.03))
# 找到特征点
p0 = cv2.goodFeaturesToTrack(gray1, mask=None, **lk_params)
# 计算光流
p1, st, err = cv2.calcOpticalFlowPyrLK(gray1, gray2, p0, None, **lk_params)
# 可视化光流
for i, (new, old) in enumerate(zip(p1, p0)):
a, b = new.ravel()
c, d = old.ravel()
cv2.line(frame2, (a, b), (c, d), (0, 255, 0), 2)
# 显示结果
cv2.imshow('frame2', frame2)
cv2.waitKey(0)
cv2.destroyAllWindows()
```
**代码逻辑分析:**
* 读入连续帧图像并转换为灰度图像。
* 使用`cv2.goodFeaturesToTrack()`函数找到特征点。
* 使用`cv2.calcOpticalFlowPyrLK()`函数计算特征点的光流。
* 可视化光流场。
**参数说明:**
* `winSize`:光流窗口的大小。
* `maxLevel`:金字塔层数。
* `criteria`:终止条件,包括最大迭代次数和光流精度。
#### 3.1.2 Farneback光流法
Farneback光流法是一种基于多尺

 百万级
高质量VIP文章无限畅学
百万级
高质量VIP文章无限畅学
 千万级
优质资源任意下载
千万级
优质资源任意下载
 C知道
免费提问 ( 生成式Al产品 )
C知道
免费提问 ( 生成式Al产品 )
0
0
相关推荐

专栏简介
本专栏以 OpenCV Python 为核心,提供了一系列深入浅出的教程和实战案例,涵盖了计算机视觉的各个方面。从图像处理的基础知识,如滤波、变换和分割,到高级技术,如人脸识别、视频分析、图像分类和增强。专栏还深入探讨了图像分割、透视变换、特征提取、图像配准、物体追踪、运动估计、立体视觉、图像生成、图像风格迁移、图像去噪和图像修复等主题。通过这些教程和案例,读者可以掌握 OpenCV Python 的强大功能,并将其应用于各种计算机视觉项目中,提升图像识别、处理和分析能力。
专栏目录
最低0.47元/天 解锁专栏
买1年送3月
百万级
高质量VIP文章无限畅学
千万级
优质资源任意下载
C知道
免费提问 ( 生成式Al产品 )
最新推荐
【停车场管理新策略:E7+平台高级数据分析】
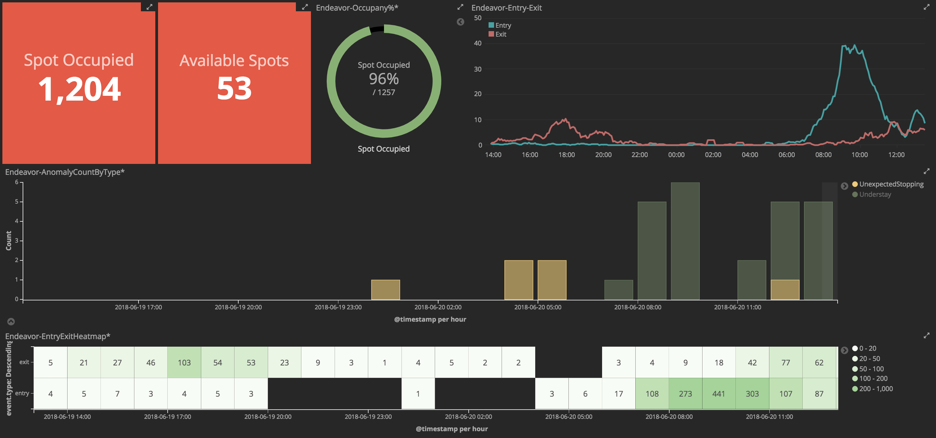
# 摘要
E7+平台是一个集数据收集、整合和分析于一体的智能停车场管理系统。本文首先对E7+平台进行介绍,然后详细讨论了停车场数据的收集与整合方法,包括传感器数据采集技术和现场数据规范化处理。在数据分析理论基础章节,本文阐述了统计分析、时间序列分析、聚类分析及预测模型等高级数据分析技术。E7+平台数据分析实践部分重点分析了实时数据处理及历史数据分析报告的生成。此外,本文还探讨了高级分析技术在交通流
【固件升级必经之路】:从零开始的光猫固件更新教程

# 摘要
固件升级是光猫设备持续稳定运行的重要环节,本文对固件升级的概念、重要性、风险及更新前的准备、下载备份、更新过程和升级后的测试优化进行了系统解析。详细阐述了光猫的工作原理、固件的作用及其更新的重要性,以及在升级过程中应如何确保兼容性、准备必要的工具和资料。同时,本文还提供了光猫固件下载、验证和备份的详细步骤,强调了更新过程中的安全措施,以及更新后应如何进行测试和优化配置以提高光猫的性能和稳定性。
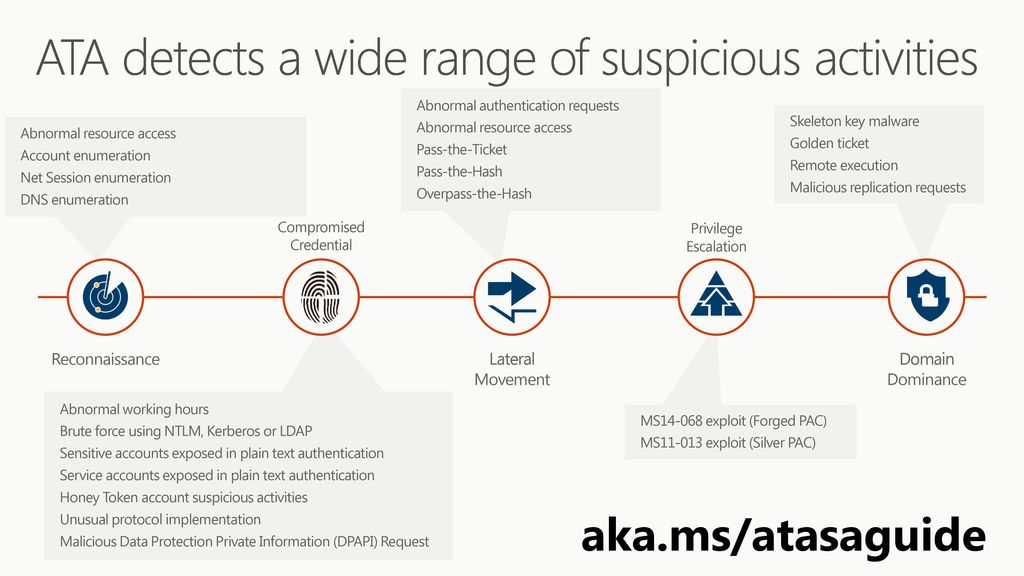
【功能深度解析】:麒麟v10 Openssh新特性应用与案例研究

# 摘要
本文详细介绍了麒麟v10操作系统集成的OpenSSH的新特性、配置、部署以及实践应用案例。文章首先概述了麒麟v10与OpenSSH的基础信息,随后深入探讨了其核心新特性的三个主要方面:安全性增强、性能提升和用户体验改进。具体包括增加的加密算法支持、客户端认证方式更新、传输速度优化和多路复用机制等。接着,文中描述了如何进行安全配置、高级配置选项以及部署策略,确保系
QT多线程编程:并发与数据共享,解决之道详解

# 摘要
本文全面探讨了基于QT框架的多线程编程技术,从基础概念到高级应用,涵盖线程创建、通信、同步,以及数据共享与并发控制等多个方面。文章首先介绍了QT多线程编程的基本概念和基础架构,重点讨论了线程间的通信和同步机制,如信号与槽、互斥锁和条件变量。随后深入分析了数据共享问题及其解决方案,包括线程局部存储和原子操作。在
【Green Hills系统性能提升宝典】:高级技巧助你飞速提高系统性能
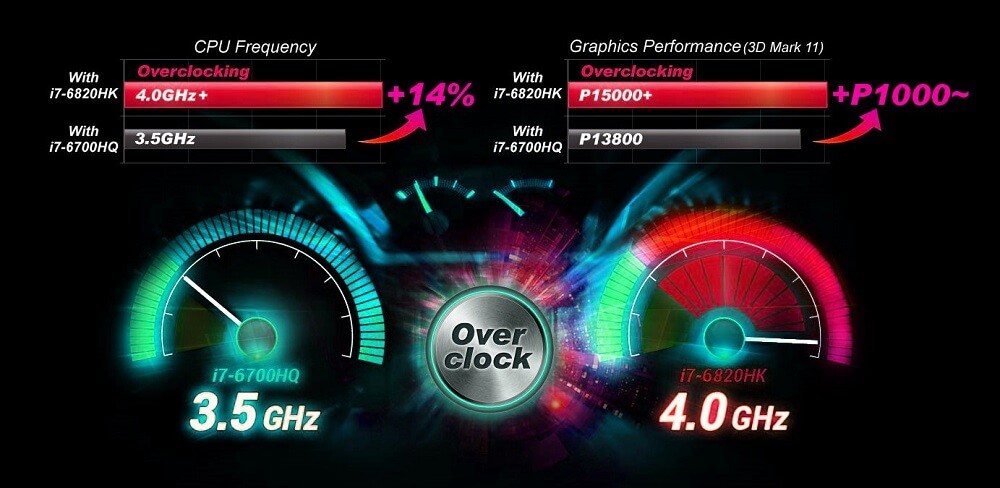
# 摘要
系统性能优化是确保软件高效、稳定运行的关键。本文首先概述了性能优化的重要性,并详细介绍了性能评估与监控的方法,包括对CPU、内存和磁盘I/O性能的监控指标以及相关监控工具的使用。接着,文章深入探讨了系统级性能优化策略,涉及内核调整、应用程序优化和系统资源管理。针对内存管理,本文分析了内存泄漏检测、缓存优化以及内存压缩技术。最后,文章研究了网络与
MTK-ATA与USB互操作性深入分析:确保设备兼容性的黄金策略
# 摘要
本文深入探讨了MTK-ATA与USB技术的互操作性,重点分析了两者在不同设备中的应用、兼容性问题、协同工作原理及优化调试策略。通过阐述MTK-ATA技术原理、功能及优化方法,并对比USB技术的基本原理和分类,本文揭示了两者结合时可能遇到的兼容性问题及其解决方案。同时,通过多个实际应用案例的分析,本文展示
零基础学习PCtoLCD2002:图形用户界面设计与LCD显示技术速成
# 摘要
随着图形用户界面(GUI)和显示技术的发展,PCtoLCD2002作为一种流行的接口工具,已经成为连接计算机与LCD显示设备的重要桥梁。本文首先介绍了图形用户界面设计的基本原则和LCD显示技术的基础知识,然后详细阐述了PCtoLCD200
【TIB文件编辑终极教程】:一学就会的步骤教你轻松打开TIB文件

# 摘要
TIB文件格式作为特定类型的镜像文件,在数据备份和系统恢复领域具有重要的应用价值。本文从TIB文件的概述和基础知识开始,深入分析了其基本结构、创建流程和应用场景,同时与其他常见的镜像文件格式进行了对比。文章进一步探讨了如何打开和编辑TIB文件,并详细介绍了编辑工具的选择、安装和使用方法。本文还对TIB文件内容的深入挖掘提供了实践指导,包括数据块结构的解析
单级放大器稳定性分析:9个最佳实践,确保设备性能持久稳定

# 摘要
单级放大器稳定性对于电子系统性能至关重要。本文从理论基础出发,深入探讨了单级放大器的工作原理、稳定性条件及其理论标准,同时分析了稳定性分析的不同方法。为了确保设计的稳定性,本文提供了关于元件选择、电路补偿技术及预防振荡措施的最佳实践。此外,文章还详细介绍了稳定性仿真与测试流程、测试设备的使用、测试结果的分析方法以及仿真与测试结果的对比研究。通过对成功与失败案例的分析,总结了实际应用中稳定性解决方案的实施经验与教训。最后,展望了未来放
信号传输的秘密武器:【FFT在通信系统中的角色】的深入探讨

# 摘要
快速傅里叶变换(FFT)是一种高效的离散傅里叶变换算法,广泛应用于数字信号处理领域,特别是在频谱分析、滤波处理、压缩编码以及通信系统信号处理方面。本文
资源上传下载、课程学习等过程中有任何疑问或建议,欢迎提出宝贵意见哦~我们会及时处理!
点击此处反馈


专栏目录
最低0.47元/天 解锁专栏
买1年送3月
百万级
高质量VIP文章无限畅学
千万级
优质资源任意下载
C知道
免费提问 ( 生成式Al产品 )