OpenCV ROI操作与图像分析:测量、计数和特征提取的利器
发布时间: 2024-08-12 02:38:15 阅读量: 41 订阅数: 22 

2024年OpenCV基础功能快速上手指南:图像处理与特征提取
# 1. OpenCV ROI操作概述**
ROI(感兴趣区域)操作是计算机视觉中一项基本技术,用于处理图像或视频中的特定区域。OpenCV(开放计算机视觉库)提供了一系列强大的函数来执行ROI操作,使开发人员能够有效地分析和操作图像数据。
ROI操作涉及定义图像中感兴趣的特定区域,然后对该区域执行各种操作。这允许开发人员专注于图像的特定部分,而忽略其他无关区域。ROI操作在图像处理和分析中广泛应用,包括对象检测、图像分割和特征提取。
# 2. ROI操作的理论基础**
### 2.1 图像区域的概念和表示
图像区域(ROI),是指图像中感兴趣的特定区域。在OpenCV中,ROI可以表示为矩形、圆形或多边形等形状。
**矩形ROI:**
```python
import cv2
# 定义矩形ROI
roi = (x, y, w, h) # (左上角x坐标, 左上角y坐标, 宽度, 高度)
# 裁剪图像
cropped_image = image[y:y+h, x:x+w]
```
**圆形ROI:**
```python
import cv2
# 定义圆形ROI
roi = (x, y, r) # (圆心x坐标, 圆心y坐标, 半径)
# 裁剪图像
mask = np.zeros(image.shape[:2], dtype=np.uint8)
cv2.circle(mask, (x, y), r, (255, 255, 255), -1)
cropped_image = cv2.bitwise_and(image, image, mask=mask)
```
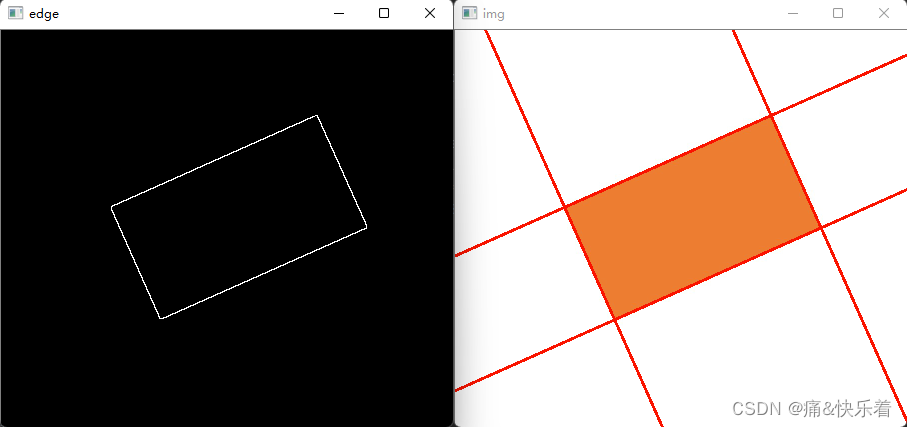
**多边形ROI:**
```python
import cv2
# 定义多边形ROI
roi = np.array([[x1, y1], [x2, y2], ..., [xn, yn]]) # 多边形顶点坐标
# 裁剪图像
mask = np.zeros(image.shape[:2], dtype=np.uint8)
cv2.fillPoly(mask, [roi], (255, 255, 255))
cropped_image = cv2.bitwise_and(image, image, mask=mask)
```
### 2.2 ROI操作的类型和功能
ROI操作包括以下类型:
**裁剪:**从图像中提取ROI区域。
**掩码:**使用ROI区域创建掩码,用于图像处理操作。
**计算:**在ROI区域内计算图像统计信息(如面积、周长等)。
**分析:**在ROI区域内进行图像分析(如形状识别、特征提取等)。
ROI操作广泛应用于图像处理和计算机视觉领域,包括:
* **医学图像分析:**分割和分析感兴趣的解剖结构。
* **工业检测和自动化:**识别和定位缺陷或目标对象。
* **计算机视觉和人机交互:**跟踪对象、识别手势和表情。
# 3. ROI操作的实践应用**
### 3.1 ROI的创建和选择
ROI操作的第一步是创建和选择感兴趣的区域。OpenCV提供了多种方法来实现此目的:
- **Rect类:**使用`cv2.Rect(x, y, w, h)`创建矩形ROI,其中`x`和`y`是左上角坐标,`w`和`h`是宽度和高度。
- **boundingRect()方法:**自动计算图像中对象的最小外接矩形。
- **selectROI()方法:**允许用户交互式地选择ROI。
### 3.2 图像测量和分析
ROI操作的一个重要应用是图像测量和分析。OpenCV提供了一系列函数来执行这些任务:
#### 3.2.1 面积和周长的计算
- **contourArea()方法:**计算轮廓的面积。
- **arcLength()方法:**计算轮廓的周长。
#### 3.2.2 形状和特征的识别
- **convexHull()方法:**计算轮廓的凸包。
- **minAreaRect()方法:**计算轮廓的最小外接矩形。
- **boundingRect()方法:**计算轮廓的最小外接矩形。
### 3.3 图像计数和统计
ROI操作还可以用于图像计数和统计:
#### 3.3.1 物体的计数和分类
- **findContours()方法:**查找图像中的轮廓。
- **drawContours()方法:**绘制轮廓。
- **groupRectangles()方法:**将重叠的矩形分组。
#### 3.3.2 数据的统计和可视化
- **histogram()方法:**计算图像中像素值的直方图。
- **calcHist()方法:**计算多维直方图。
- **imshow()方法:**

 百万级
高质量VIP文章无限畅学
百万级
高质量VIP文章无限畅学
 千万级
优质资源任意下载
千万级
优质资源任意下载
 C知道
免费提问 ( 生成式Al产品 )
C知道
免费提问 ( 生成式Al产品 )
0
0
相关推荐

专栏简介
OpenCV ROI(感兴趣区域)操作是计算机视觉和图像处理领域的一项核心技术。它允许开发者在图像或视频帧的特定区域执行操作,从而实现各种图像处理任务。
本专栏深入探讨了 OpenCV ROI 操作的原理、技巧和应用场景。从图像处理到深度学习,ROI 操作在图像分割、目标检测、图像增强、图像融合、图像分析、图像编辑、图像压缩、图像修复、图像生成和图像变形等领域发挥着至关重要的作用。
通过 10 大应用场景、15 个实用技巧、5 个优化秘籍、原理大揭秘、实战演练、与深度学习联手出击、在计算机视觉中的关键作用等主题,本专栏全面介绍了 OpenCV ROI 操作的方方面面,帮助开发者掌握这项图像处理核心技术,提升图像处理效率和效果。
专栏目录
最低0.47元/天 解锁专栏
买1年送3月
百万级
高质量VIP文章无限畅学
千万级
优质资源任意下载
C知道
免费提问 ( 生成式Al产品 )
最新推荐
供应链革新:EPC C1G2协议在管理中的实际应用案例
# 摘要
EPC C1G2协议作为一项在射频识别技术中广泛采用的标准,在供应链管理和物联网领域发挥着关键作用。本文首先介绍了EPC C1G2协议的基础知识,包括其结构、工作原理及关键技术。接着,通过分析制造业、物流和零售业中的应用案例,展示了该协议如何提升效率、优化操作和增强用户体验。文章还探讨了实施EPC C1G2协议时面临的技术挑战,并提出了一系列解决方案及优化策略。最后,本文提供了一份最佳实践指南,旨在指导读者顺利完成EPC C1G2协议的实施,并评估其效果。本文为EPC C1G2协议的深入理解和有效应用提供了全面的视角。
# 关键字
EPC C1G2协议;射频识别技术;物联网;供应链管
【数据结构与算法实战】

# 摘要
数据结构与算法是计算机科学的基础,对于软件开发和系统设计至关重要。本文详细探讨了数据结构与算法的核心概念,对常见数据结构如数组、链表、栈、队列和树等进行了深入分析,同
【Ansys参数设置实操教程】:7个案例带你精通模拟分析
# 摘要
本文系统地介绍了Ansys软件中参数设置的基础知识与高级技巧,涵盖了结构分析、热分析和流体动力学等多方面应用。通过理论与实际案例的结合,文章首先强调了Ansys参数设置的重要性,并详细阐述了各种参数类型、数据结构和设置方法。进一步地,本文展示了如何在不同类型的工程分析中应用这些参数,并通过实例分析,提供了参数设置的实战经验,包括参数化建模、耦合分析以及参数优化等方面。最后,文章展望
【离散时间信号与系统】:第三版习题解密,实用技巧大公开

# 摘要
离散时间信号与系统的分析和处理是数字信号处理领域中的核心内容。本文全面系统地介绍了离散时间信号的基本概念、离散时间系统的分类及特性、Z变换的理论与实践应用、以及离散时间信号处理的高级主题。通过对Z变换定义、性质和在信号处理中的具体应用进行深入探讨,本文不仅涵盖了系统函数的Z域表示和稳定性分析,还包括了Z变换的计算方法,如部分分式展开法、留数法及逆Z变换的数值计算方法。同时,本文还对离散时间系
立体声分离度:测试重要性与提升收音机性能的技巧

# 摘要
立体声分离度是评估音质和声场表现的重要参数,它直接关联到用户的听觉体验和音频设备的性能。本文全面探讨了立体声分离度的基础概念、测试重要性、影响因素以及硬件和软件层面的提升措施。文章不仅分析了麦克风布局、信号处理技术、音频电路设计等硬件因素,还探讨了音频编辑软件、编码传输优化以及后期处理等软件策略对分离度的正面影响。通过实战应用案例分析,本文展示了在收音机和音频产品开
【热分析高级技巧】:活化能数据解读的专家指南
# 摘要
热分析技术作为物质特性研究的重要方法,涉及到对材料在温度变化下的物理和化学行为进行监测。本论文全面概述了热分析技术的基础知识,重点阐述了活化能理论,探讨了活化能的定义、重要性以及其与化学反应速率的关系。文章详细介绍了活化能的多种计算方法,包括阿伦尼乌斯方程及其他模型,并讨论了活化能数据分析技术,如热动力学分析法和微分扫描量热法(DSC)。同时,本文还提供了活化能实验操作技巧,包括实验设计、样品准备、仪器使用
ETA6884移动电源温度管理:如何实现最佳冷却效果

# 摘要
本论文旨在探讨ETA6884移动电源的温度管理问题。首先,文章概述了温度管理在移动电源中的重要性,并介绍了相关的热力学基础理论。接着,详细分析了移动电源内部温度分布特性及其对充放电过程的影响。第三章阐述了温度管理系统的设计原则和传感器技术,以及主动与被动冷却系统的具体实施。第四章通过实验设计和测试方法评估了冷却系统的性能,并提出了改进策略。最后,
【PCM测试高级解读】:精通参数调整与测试结果分析
# 摘要
PCM测试作为衡量系统性能的重要手段,在硬件配置、软件环境搭建以及参数调整等多个方面起着关键作用。本文首先介绍PCM测试的基础概念和关键参数,包括它们的定义、作用及其相互影响。随后,文章深入分析了测试结果的数据分析、可视化处理和性能评估方法。在应用实践方面,本文探讨了PCM测试在系统优化、故障排除和性能监控中的实际应用案例。此外,文章还分享了PCM测试的高级技巧与最佳实践,并对测试技术未来
资源上传下载、课程学习等过程中有任何疑问或建议,欢迎提出宝贵意见哦~我们会及时处理!
点击此处反馈


专栏目录
最低0.47元/天 解锁专栏
买1年送3月
百万级
高质量VIP文章无限畅学
千万级
优质资源任意下载
C知道
免费提问 ( 生成式Al产品 )