Python数据可视化:使用Matplotlib和Seaborn创建交互式图表,让数据栩栩如生
发布时间: 2024-06-19 01:41:39 阅读量: 107 订阅数: 36 

Python data visualizations with Seaborn _ Matplotlib
# 1. Python数据可视化概述
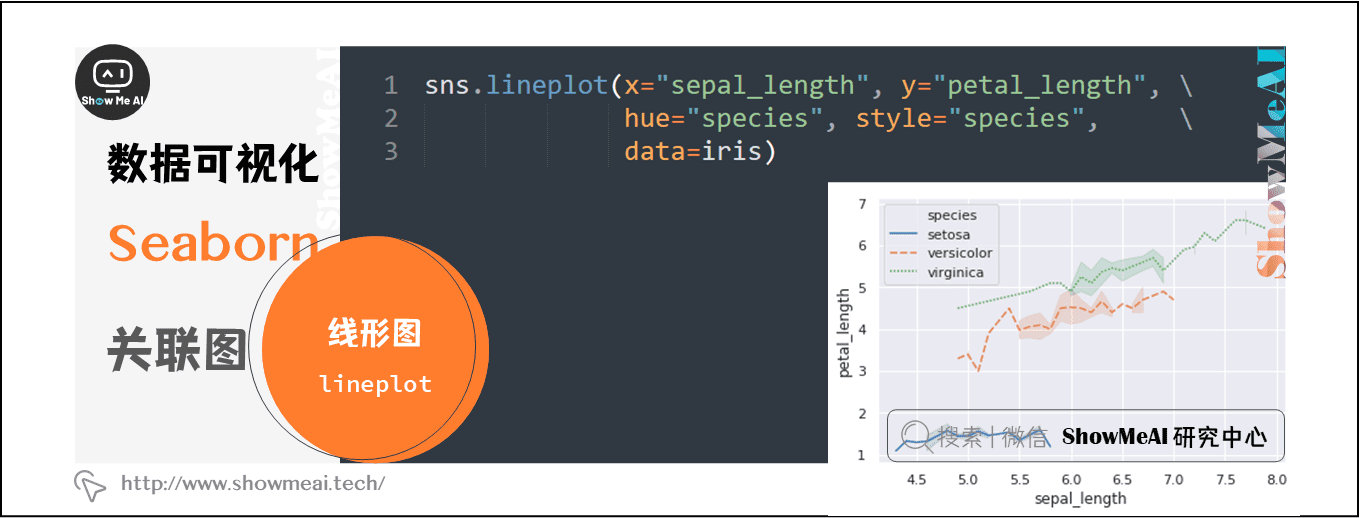
数据可视化是将数据转换为图形表示的一种技术,以便于理解和分析。Python提供了丰富的库,例如Matplotlib、Seaborn和Plotly,用于创建各种类型的图表和图形。
数据可视化在IT行业至关重要,因为它可以帮助:
- **识别趋势和模式:**图表可以揭示数据中的隐藏趋势和模式,这对于决策制定至关重要。
- **传达复杂信息:**图表可以以易于理解的方式传达复杂的信息,这对于非技术受众特别有用。
- **监控系统性能:**仪表盘和交互式图表可以提供实时数据,以便监控系统性能和识别问题。
# 2. Matplotlib基础
### 2.1 Matplotlib的安装和配置
**安装**
```
pip install matplotlib
```
**配置**
* **交互式模式:** `matplotlib.pyplot.ion()`
* **显示图形:** `matplotlib.pyplot.show()`
* **保存图形:** `matplotlib.pyplot.savefig('filename.png')`
### 2.2 Matplotlib的基本绘图功能
#### 2.2.1 折线图、柱状图和饼状图
**折线图**
```python
import matplotlib.pyplot as plt
# 数据
x = [1, 2, 3, 4, 5]
y = [2, 4, 6, 8, 10]
# 绘制折线图
plt.plot(x, y)
plt.xlabel('x')
plt.ylabel('y')
plt.title('折线图')
plt.show()
```
**柱状图**
```python
# 数据
x = ['A', 'B', 'C', 'D', 'E']
y = [10, 20, 30, 40, 50]
# 绘制柱状图
plt.bar(x, y)
plt.xlabel('类别')
plt.ylabel('值')
plt.title('柱状图')
plt.show()
```
**饼状图**
```python
# 数据
labels = ['A', 'B', 'C', 'D']
sizes = [10, 20, 30, 40]
# 绘制饼状图
plt.pie(sizes, labels=labels, autopct='%1.1f%%')
plt.title('饼状图')
plt.show()
```
#### 2.2.2 散点图和直方图
**散点图**
```python
# 数据
x = [1, 2, 3, 4, 5]
y = [2, 4, 6, 8, 10]
# 绘制散点图
plt.scatter(x, y)
plt.xlabel('x')
plt.ylabel('y')
plt.title('散点图')
plt.show()
```
**直方图**
```python
# 数据
data = [1, 2, 3, 4, 5, 6, 7, 8, 9, 10]
# 绘制直方图
plt.hist(data)
plt.xlabel('值')
plt.ylabel('频率')
plt.title('直方图')
plt.show()
```
### 2.3 Matplotlib的交互式绘图
#### 2.3.1 交互式模式
```python
import matplotlib.pyplot as plt
# 启用交互式模式
plt.ion()
# 绘制图形
plt.plot([1, 2, 3, 4, 5], [2, 4, 6, 8, 10])
# 允许用户交互
plt.show()
# 禁用交互式模式
plt.ioff()
```
#### 2.3.2 图形缩放和平移
*

 百万级
高质量VIP文章无限畅学
百万级
高质量VIP文章无限畅学
 千万级
优质资源任意下载
千万级
优质资源任意下载
 C知道
免费提问 ( 生成式Al产品 )
C知道
免费提问 ( 生成式Al产品 )
0
0
相关推荐

专栏简介
本专栏是一个全面的 Python 指南,涵盖从入门到高级主题。专栏包括深入的教程,涵盖 Python 基础、代码优化、数据结构、面向对象编程、机器学习、数据可视化、Web 开发、并行编程、云计算、调试、性能分析、单元测试、代码重构、大数据处理和安全编程。通过这些文章,读者可以掌握 Python 的各个方面,从基础语法到构建复杂应用程序。本专栏旨在帮助初学者快速入门 Python,并为经验丰富的开发者提供深入的知识和技巧,以提升他们的 Python 编程技能。
专栏目录
最低0.47元/天 解锁专栏
买1年送3月
百万级
高质量VIP文章无限畅学
千万级
优质资源任意下载
C知道
免费提问 ( 生成式Al产品 )
最新推荐
【EDEM仿真非球形粒子专家】:揭秘提升仿真准确性的核心技术

# 1. EDEM仿真软件概述与非球形粒子的重要性
## 1.1 EDEM仿真软件简介
EDEM是一种用于粒子模拟的仿真工具,能够准确地模拟和分析各种离散元方法(Discrete Element Method, DEM)问题。该软件广泛应用于采矿
雷达数据压缩技术突破:提升效率与存储优化新策略

# 1. 雷达数据压缩技术概述
在现代军事和民用领域,雷达系统产生了大量的数据,这些数据的处理和存储是技术进步的关键。本章旨在对雷达数据压缩技术进行简要
SaTScan软件的扩展应用:与其他统计软件的协同工作揭秘

# 1. SaTScan软件概述
SaTScan是一种用于空间、时间和空间时间数据分析的免费软件,它通过可变动的圆形窗口统计分析方法来识别数据中的异常聚集。本章将简要介绍SaTScan的起源、功能及如何在不同领域中得到应用。SaTScan软件特别适合公共卫生研究、环境监测和流行病学调查等领域,能够帮助研究人员和决策者发现数据中的模式和异常,进行预防和控制策略的制定。
在
SGMII传输层优化:延迟与吞吐量的双重提升技术

# 1. SGMII传输层优化概述
在信息技术不断发展的今天,网络传输的效率直接影响着整个系统的性能。作为以太网物理层的标准之一,SGMII(Serial Gigabit Media Independent Interface)在高性能网络设计中起着至关重要的作用。SGMII传输层优化,就是通过一系列手段来提高数据传输效率,减少延迟,提升吞吐量,从而达到优化整个网络性能的目
Java SPI与依赖注入(DI)整合:技术策略与实践案例
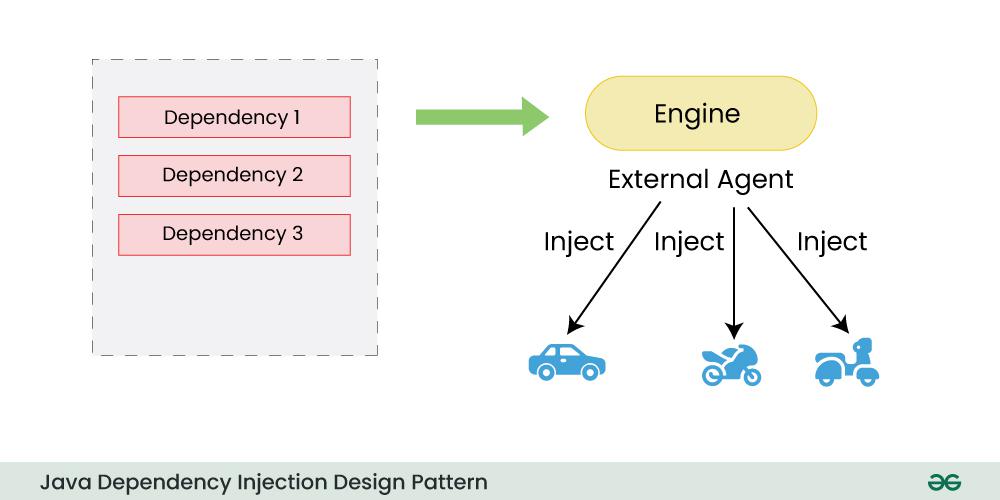
# 1. Java SPI机制概述
## 1.1 SPI的概念与作用
Service Provider Interface(SPI)是Java提供的一套服务发现机制,允许我们在运行时动态地提供和替换服务实现。它主要被用来实现模块之间的解耦,使得系统更加灵活,易于扩展。通过定义一个接口以及一个用于存放具体服务实现类的配置文件,我们可以轻松地在不修改现有代码的情况下,增加或替换底
【矩阵求逆的历史演变】:从高斯到现代算法的发展之旅

# 1. 矩阵求逆概念的起源与基础
## 1.1 起源背景
矩阵求逆是线性代数中的一个重要概念,其起源可以追溯到19世纪初,当时科学家们开始探索线性方程组的解法。早期的数学家如高斯(Carl Friedrich Gauss)通过消元法解决了线性方程组问题,为矩阵求逆奠定了基础。
社交网络分析工具大比拼:Gephi, NodeXL, UCINET优劣全面对比
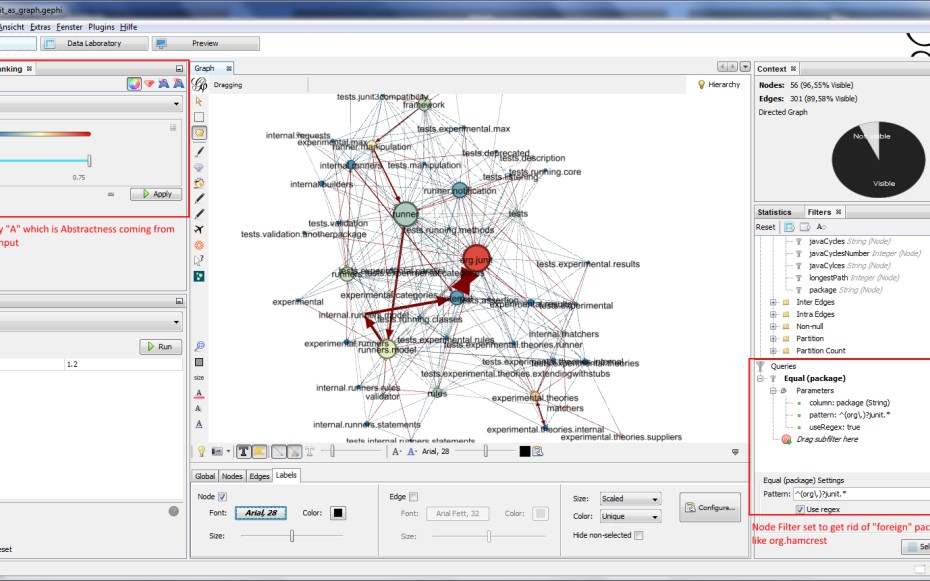
# 1. 社交网络分析概述
社交网络分析是理解和揭示社会结构和信息流的一种强有力的工具,它跨越了人文和社会科学的边界,找到了在计算机科学中的一个牢固立足点。这一分析不仅限于对人际关系的研究,更扩展到信息传播、影响力扩散、群体行为等多个层面。
## 1.1 社交网络分析的定义
社交网络分析(Social Network Analysis,简称SNA)是一种研究社会结构的方法论
原型设计:提升需求沟通效率的有效途径

# 1. 原型设计概述
在现代产品设计领域,原型设计扮演着至关重要的角色。它不仅是连接设计与开发的桥梁,更是一种沟通与验证设计思维的有效工具。随着技术的发展和市场对产品快速迭代的要求不断提高,原型设计已经成为产品生命周期中不可或缺的一环。通过创建原型,设计师能够快速理解用户需求,验证产品概念,及早发现潜在问题,并有效地与项目相关方沟通想法,从而推动产品向前发展。本章将对原型设计的必要性、演变以及其在产品开发过程中的作
Python环境监控高可用构建:可靠性增强的策略

# 1. Python环境监控高可用构建概述
在构建Python环境监控系统时,确保系统的高可用性是至关重要的。监控系统不仅要在系统正常运行时提供实时的性能指标,而且在出现故障或性能瓶颈时,能够迅速响应并采取措施,避免业务中断。高可用监控系统的设计需要综合考虑监控范围、系统架构、工具选型等多个方面,以达到对资源消耗最小化、数据准确性和响应速度最优化的目
【信号异常检测法】:FFT在信号突变识别中的关键作用
# 1. 信号异常检测法基础
## 1.1 信号异常检测的重要性
在众多的IT和相关领域中,从工业监控到医疗设备,信号异常检测是确保系统安全和可靠运行的关键技术。信号异常检测的目的是及时发现数据中的不规则模式,这些模式可能表明了设备故障、网络攻击或其他需要立即关注的问题。
## 1.2 信号异常检测方法概述
信号异常检测的方法多种多样,包括统计学方法、机器学习方法、以及基于特定信号
资源上传下载、课程学习等过程中有任何疑问或建议,欢迎提出宝贵意见哦~我们会及时处理!
点击此处反馈


专栏目录
最低0.47元/天 解锁专栏
买1年送3月
百万级
高质量VIP文章无限畅学
千万级
优质资源任意下载
C知道
免费提问 ( 生成式Al产品 )