ER图与数据分析:如何使用ER图支持数据分析
发布时间: 2024-07-22 04:54:56 阅读量: 68 订阅数: 28 

ER图是一种用于描述数据模型的概念图.docx
# 1. ER图基础
**1.1 ER图的概念**
实体关系图(ER图)是一种数据建模工具,用于描述真实世界中的实体、属性和它们之间的关系。它通过图形符号表示实体、属性和关系,以直观的方式展示数据结构。
**1.2 ER图的组成要素**
ER图由以下主要元素组成:
- **实体:**表示真实世界中的对象或概念,如客户、产品或订单。
- **属性:**描述实体的特征,如客户的姓名、产品的价格或订单的日期。
- **关系:**表示实体之间的关联,如客户与订单之间的购买关系。
# 2. ER图建模技巧
### 2.1 ER图建模原则
#### 2.1.1 实体和属性的识别
实体是ER图中表示真实世界对象或概念的抽象。识别实体时,需要考虑以下原则:
- **区分实体和属性:**实体是独立存在的对象,而属性是描述实体特征的属性。例如,"学生"是一个实体,而"姓名"、"年龄"和"专业"是其属性。
- **实体完整性:**实体的标识属性必须唯一,以确保实体的唯一性。例如,"学生"实体的标识属性可以是"学号"。
- **属性原子性:**属性不能再细分为更小的属性。例如,"地址"属性不能再细分为"街道"、"城市"和"邮政编码"。
#### 2.1.2 关系的确定和表示
关系表示实体之间的关联。确定关系时,需要考虑以下原则:
- **关系类型:**关系可以是一对一、一对多或多对多。例如,"学生"和"课程"实体之间是一对多的关系,即一个学生可以选修多门课程,而一门课程可以有多个学生选修。
- **关系基数:**关系基数表示实体之间关系的最小和最大数量。例如,"学生"和"课程"实体之间的关系基数可以表示为(1,*),表示一个学生至少选修一门课程,而一门课程可以有多个学生选修。
- **关系属性:**关系也可以具有自己的属性,称为关系属性。例如,"学生选课"关系可以具有"成绩"属性。
### 2.2 ER图建模工具
#### 2.2.1 常用ER图建模软件
市面上有许多ER图建模软件,常见的有:
- **Visio:**微软开发的商业软件,提供专业的ER图建模功能。
- **DbSchema:**开源软件,支持多种数据库平台,提供直观的ER图编辑界面。
- **Lucidchart:**在线ER图建模工具,提供协作功能和丰富的模板。
#### 2.2.2 建模技巧和最佳实践
在使用ER图建模工具时,应遵循以下技巧和最佳实践:
- **使用命名约定:**为实体、属性和关系使用一致的命名约定,以提高ER图的可读性和可维护性。
- **保持简洁:**ER图应简洁明了,只包含必要的信息。避免过度复杂化或添加不必要的细节。
- **使用注释:**在ER图中添加注释,以解释实体、属性和关系的含义,提高

 百万级
高质量VIP文章无限畅学
百万级
高质量VIP文章无限畅学
 千万级
优质资源任意下载
千万级
优质资源任意下载
 C知道
免费提问 ( 生成式Al产品 )
C知道
免费提问 ( 生成式Al产品 )
0
0
相关推荐

专栏简介
本专栏全面探讨了实体关系图(ER 图)在数据建模中的至关重要性。从绘制清晰易懂的 ER 图的逐步指南到揭示 ER 图背后的秘密,再到解决常见问题的实战技巧,该专栏深入探讨了 ER 图在优化数据库结构、理解数据结构、提升数据模型质量、转化为数据字典、探索与业务流程的关系、生成数据库表以及在数据仓库设计、数据集成、数据治理、数据分析、数据可视化、数据安全和数据架构中的应用。此外,该专栏还提供了对数据建模工具和方法的深入分析,并探讨了数据建模领域的最新趋势。通过提供全面的见解和实用技巧,本专栏旨在帮助读者充分利用 ER 图,以构建健壮、可扩展且易于理解的数据模型。
专栏目录
最低0.47元/天 解锁专栏
买1年送3月
百万级
高质量VIP文章无限畅学
千万级
优质资源任意下载
C知道
免费提问 ( 生成式Al产品 )
最新推荐
LTE无线资源管理:小区选择与重选的精准角色定位

# 摘要
LTE无线资源管理是确保移动通信网络性能和效率的关键技术,涉及到小区选择和重选机制的精确执行。本文从理论基础到实践应用,系统性地分析了小区选择的信号传播模型、选择标准与算法,并探讨了小区重选过程中的触发条件和优化算法。此外,本文还介绍了无线资源管理的工具和技术,以及通过案例研究分析了不同网络环境下小区选择与重选的挑战与解决方案。最后,本文展望了5G与LTE共存环境下的小区管理以及人工智能在无线资
Altium Designer中的FPGA高级布线技术:板级设计的高手之路
# 摘要
随着电子系统复杂性的增加,FPGA设计已成为集成电路设计中不可或缺的部分。本文旨在提供Altium Designer工具中FPGA设计与布线的全面概述,包括布线技术基础、高级布线功能、实际应用案例,以及板级设计中的高级主题。文中详细探讨了FPGA布线的关键技术点,如信号完整性、布线资源约束、布线优化技巧、仿真与验证,并通过案例分析展示这些技术在实际设计中的应用。此外,本文也对FPGA板级设计的高级主题如热管理和电源完整性进行了探讨,并展望了FPGA设计的未来趋势,特别是新兴技术、自动化与智能化设计流程以及与人工智能的结合。通过对FPGA设计全流程的深入分析,本文为电子工程师提供了有价
SQL代码整洁化:DBeaver V1.4格式化功能快速入门
# 摘要
本文旨在探讨SQL代码整洁化的重要性和DBeaver V1.4在格式化SQL代码中的应用与优势。首先介绍了代码整洁化对于提高代码可读性、维护性以及团队协作的重要性。随后详细介绍了DBeaver V1.4的安装过程,包括其功能介绍与发展历史,以及系统兼容性要求和安装步骤。接着,文章深入分析了DBeaver V1.4的格式化功能,从基础操作到高级设置,涵盖格式化按钮的理解、默认和自定义规则的应用、格式化配置以及快捷键的使用。文章还探讨了格式化功能在简化SQL代码维护、代码优化与调试、团队协作中的具体应用,以及如何通过高级格式化选项和集成开发环境中的整合来提升格式化的效率。最后,文章展望了
【音频处理深度指南】:DIT与DIF FFT算法应用选择技巧
# 摘要
音频处理是一个涵盖广泛技术和应用的领域,其中离散傅里叶变换(DFT)及其优化算法,特别是快速傅里叶变换(FFT),发挥着核心作用。本文从基础理论出发,详细探讨了FFT算法的原理、不同实现方式及其优化技术,并分析了在数字音频工作站(DAW)中的应用。同时,文中深入解析了直接输入(DIT)和直接输出(DIF)FFT算法,并比较了它们在不同音频处理场景中的应用效果。此外,本文还提供了关于FFT算法应用技巧的实践建议,讨论了音频质量与算法选择之间的关系,并探讨了音频处理领域的未来趋势和跨界融合可能。
# 关键字
音频处理;离散傅里叶变换(DFT);快速傅里叶变换(FFT);数字音频工作站(
【CesiumLab GIS数据整合】:打造无缝3D地理信息系统的秘诀

# 摘要
本文综合分析了CesiumLab平台在GIS数据整合及应用中的关键作用,阐述了GIS数据的分类、特性与整合的必要性,并探讨了CesiumLab的技术架构、核心技术、开发环境以及实践应用案例。文章详细介绍了CesiumLab在三维空间分析、实时数据处理和自定义应用开发中的应用,
【系统稳定性保障】:BIOS优化技巧提升系统可靠性
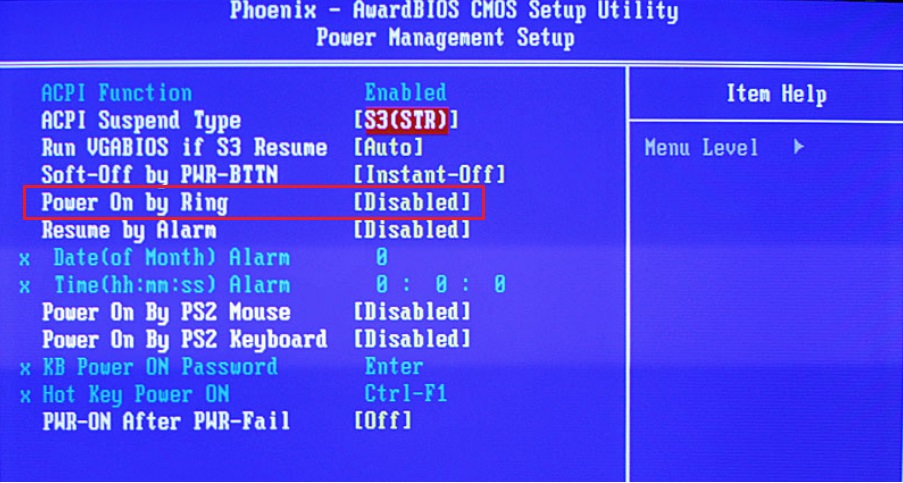
# 摘要
本文全面探讨了BIOS在现代计算机系统中的作用,强调了系统稳定性对于用户的重要性。文章从BIOS的基本概念入手,详细解析了其在硬件配置、优化、安全性设置、风险控制、性能调整以及固件更新和故障排除方面的重要性。通过深入分析BIOS的启动自检流程、电源管理、启动优先级以及超频技术,本文展示了BIOS如何对
Pilot Pioneer Expert V10.4权限管理精细指南:为安全加把锁

# 摘要
本文详细介绍了Pilot Pioneer Expert V10.4的权限管理系统的全面概述,包括权限管理的基础理论、实践应用、高级技术、面临的挑战及解决方案,最后对权限管理的未来发展趋势进行了展望。文章首先阐述了权限管理的
深入探索S型曲线:【sin²x在速度规划中的作用】的专业解读

# 摘要
本文探讨了S型曲线在速度规划中的数学原理及其应用,重点介绍了sin²x函数与速度曲线的关系。文中首先介绍了速度规划的重要性和S型曲线的特点,然后深入阐述了sin²x函数的性质及其在速度规划中的作用。接着,本文详细讨论了S型曲线的参数调整方法和在工业自动化、车辆动力学以及航海等领域的实践应用。此外,文章还探讨了si
【新手必看】:Cadence OrCad v16.3 配置要点与安装陷阱全解析
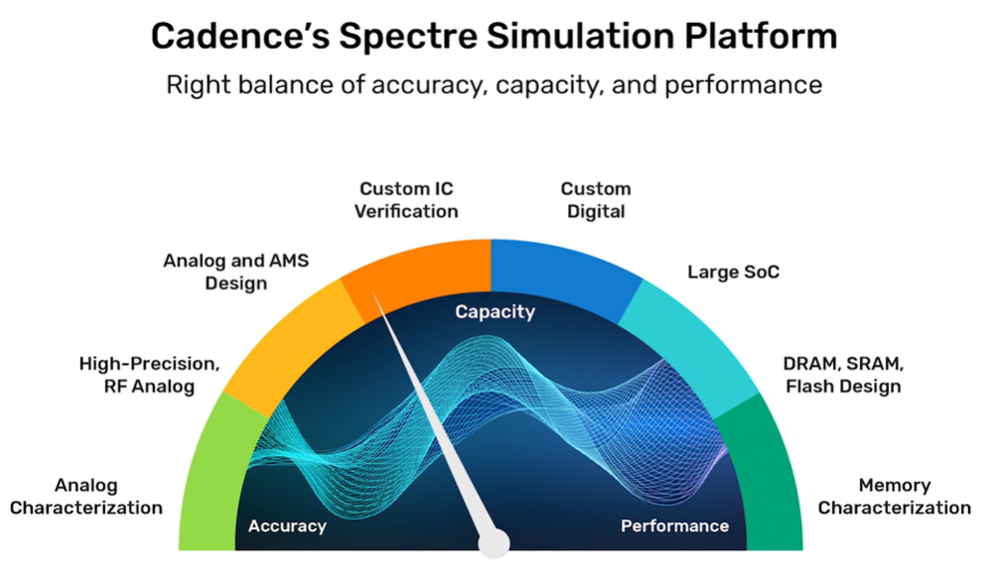
# 摘要
本文系统地介绍了Cadence OrCAD v16.3的安装与配置过程,包括系统要求、环境配置、软件安装步骤详解,以及配置要点与最佳实践。针对OrCAD软件的安装和使用,文章详细阐述了确定系统兼容性、安装前期准备工作、安装过程中的常见问题处理、安装后的配置与验证,以及高级应用和扩展功能的探索。通过这些内容,读者可以有效地管理和优化OrCAD
资源上传下载、课程学习等过程中有任何疑问或建议,欢迎提出宝贵意见哦~我们会及时处理!
点击此处反馈


专栏目录
最低0.47元/天 解锁专栏
买1年送3月
百万级
高质量VIP文章无限畅学
千万级
优质资源任意下载
C知道
免费提问 ( 生成式Al产品 )