Paradigm C++ Reference Manual
1. Close any demo projects that may be open (Project|Close project).
2. Select Debug|Load, and Browse or type in the name of the .AXE (or .HEX) file for
remote download, for example,
\paradigm\examples\demo\test.axe
3. Choose the desired remote connection interface.
4. Press the Modify settings button to change any specific remote connection settings for
the selected interface.
5. Select OK to load the application file and start debugging without the use of the
Project Manager.
Again, the debugger sets a software breakpoint at the label main in the application. If
you would rather start at the reset vector or run to a different place in the application,
then select Options|Environment|Debugger|Debugger Behavior and delete main, or
add the function name, to Run to on startup.
6. When you would like to exit stand-alone debugging mode, Select Debug|Terminate
debug session or hit Ctrl-F2.
Debugging with Paradigm C++
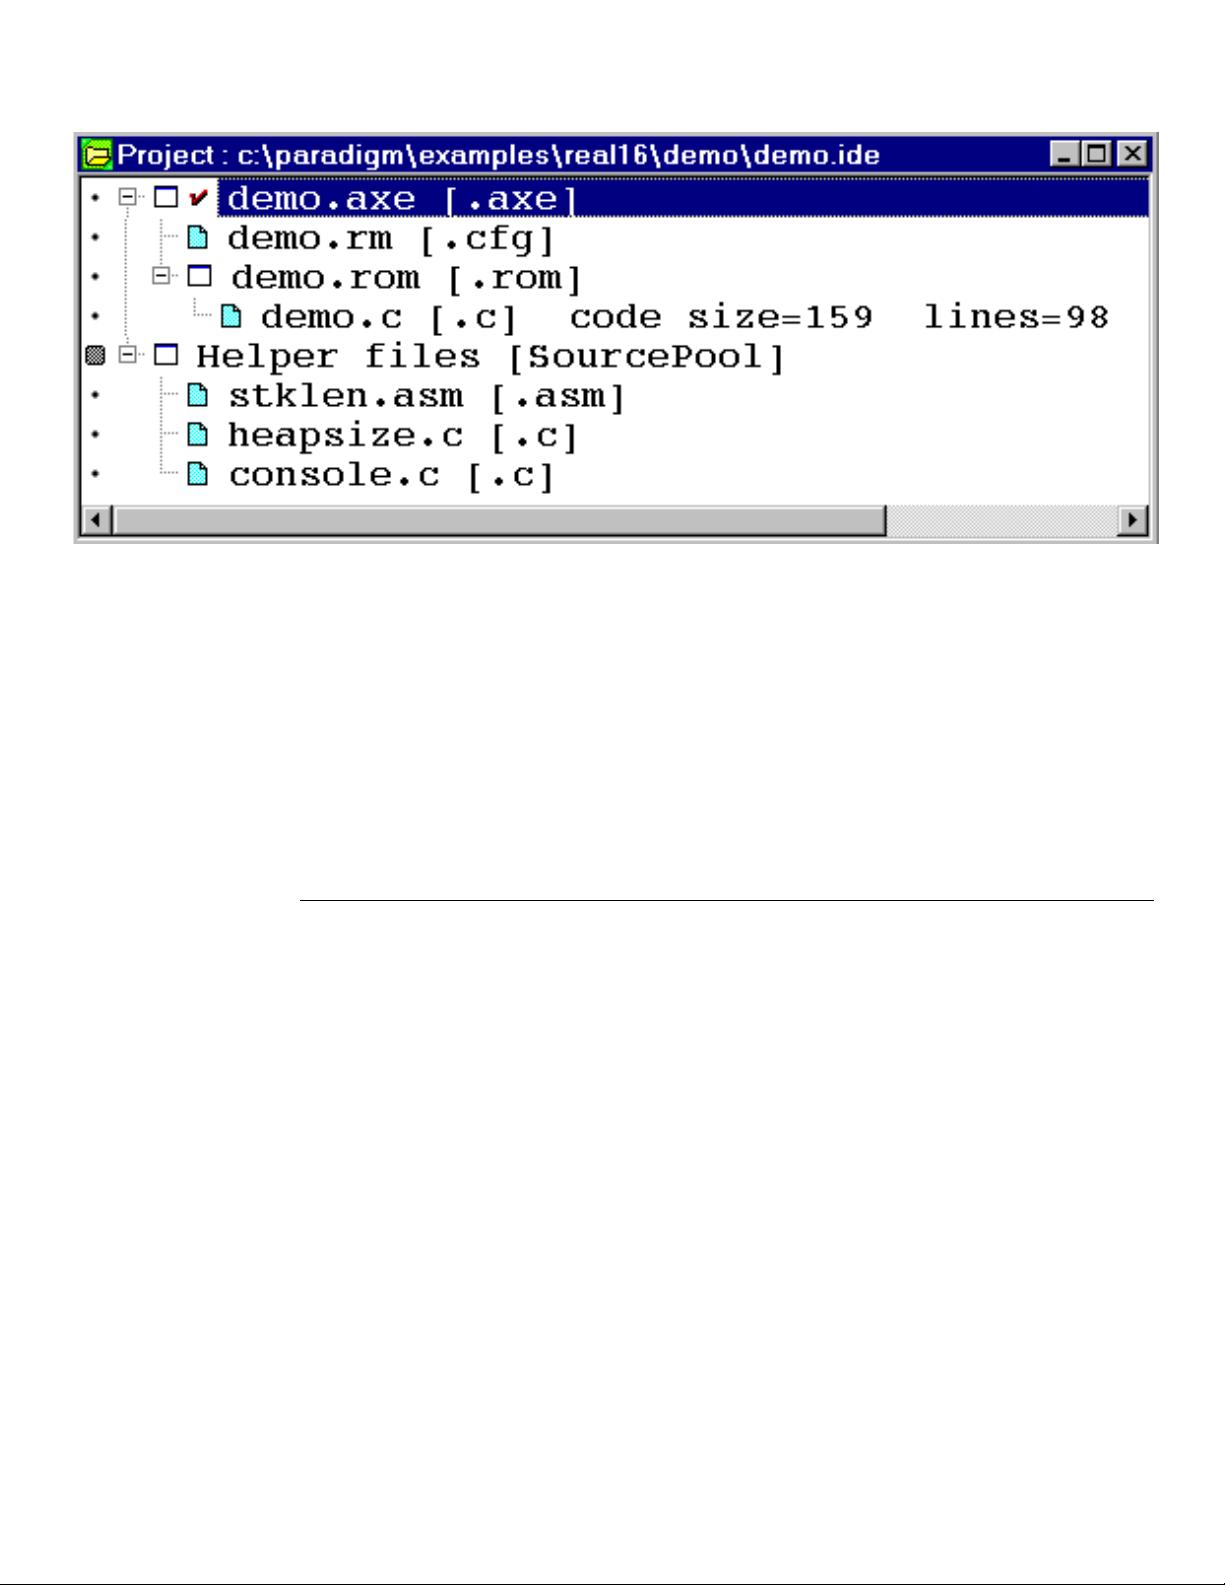
For a demonstration of debugging in Paradigm C++, open the DEMO.IDE project in
PARADIGM\EXAMPLES\REAL\DEMO as you did in “Creating a new file,” page 14
and double-click the DEMO.C node in the Project window. Right-click the DEMO.AXE
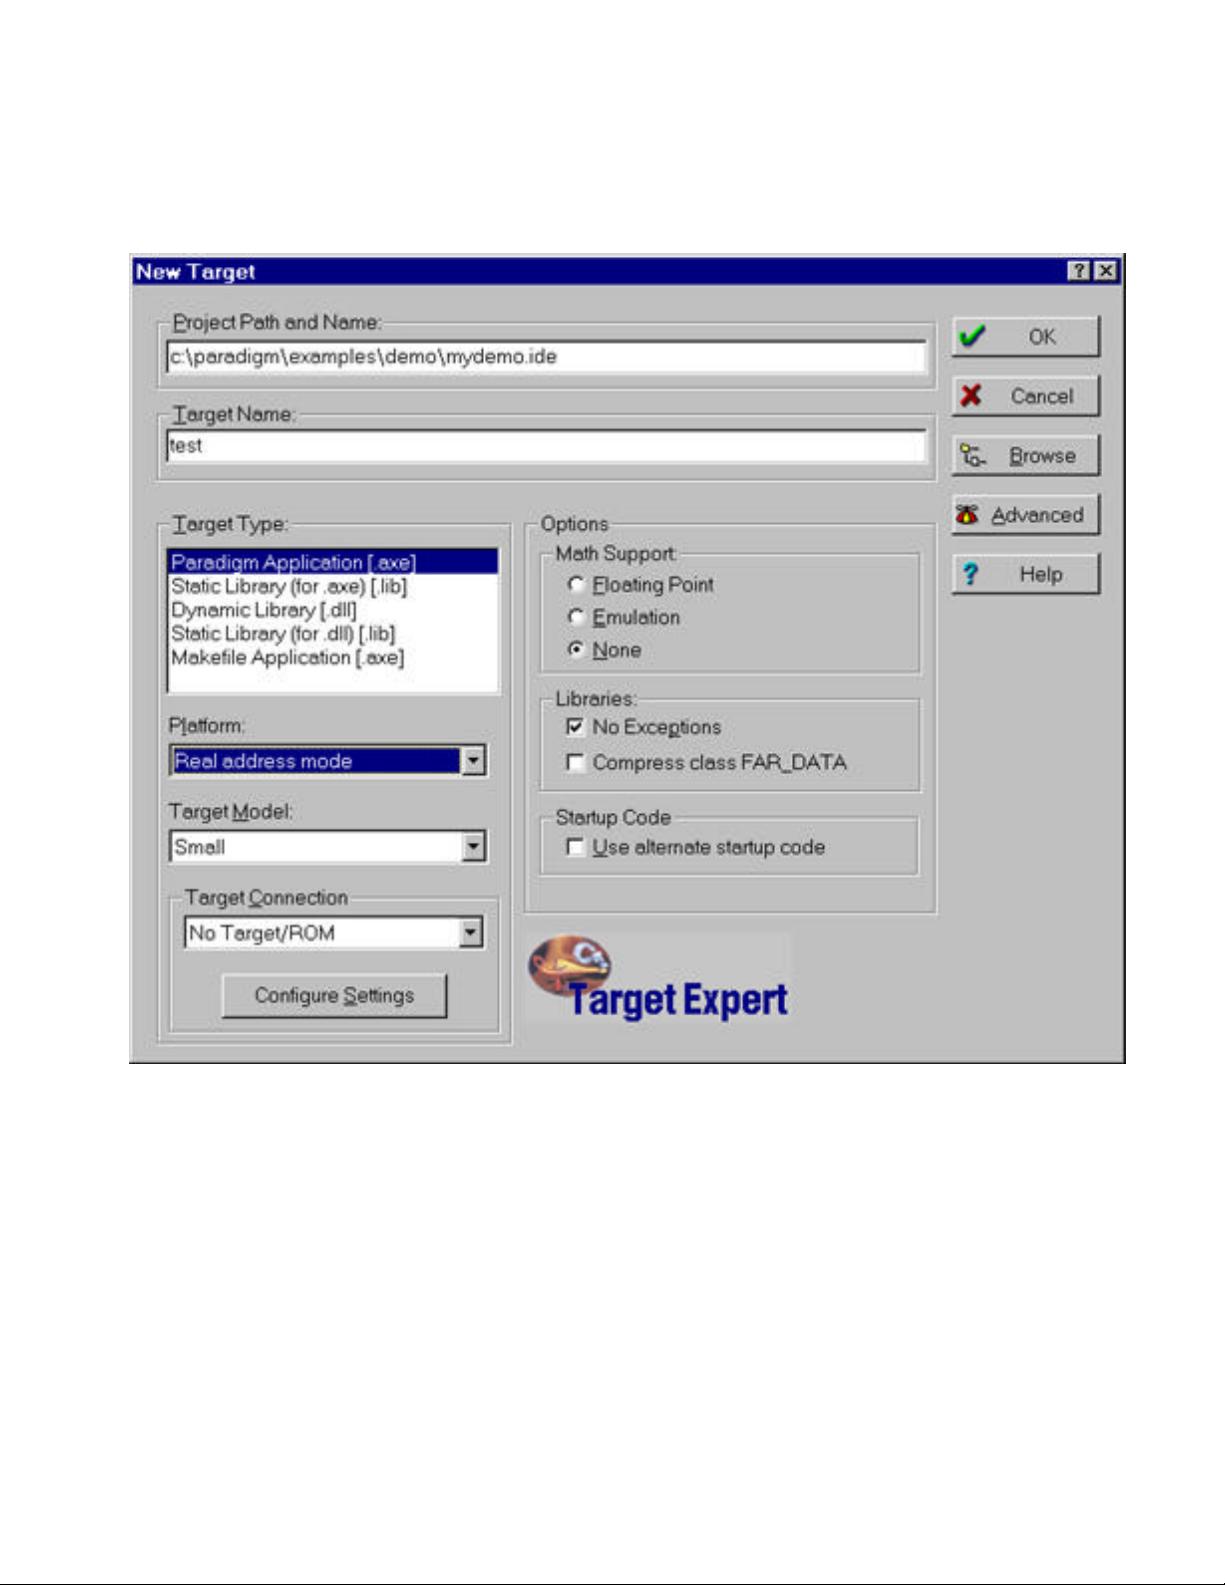
node in the Project window and select TargetExpert to ensure that the Target Connection
is set to the desired remote connection. Then simply double-click the DEMO.AXE node
in the Project window to download the application to your target. If the debugger option
to execute to main(), found under Options|Environment|Debugger|Debugger Behavior, is
enabled, the debugging session will look like Figure 1-6, page 1-21.
At this point the Debug menu commands and SpeedBar will come alive so you can
inspect program data, view the processor registers, or access target peripherals. Right-
clicking in the Edit window will bring up the debugger SpeedMenu for quick access to
debugging commands.
You can step through the program and test until you find a bug that needs fixing. Use the
Statement step into or Statement step over SpeedButtons located beneath the Menu bar to
begin debugging. You could use the Run SpeedButton but the application won't stop
unless you have set a breakpoint somewhere in the program. You can also use the Run to
here button to execute to a particular source line that the cursor is on. See Figure 1-7,
page 1-22 for a description of Paradigm C++ SpeedButtons available during a debug
session.
When you find a problem, you might notice that there is no difference between editor
windows and debugger windows. This is a big improvement over traditional tools since
you can fix a bug right away without exiting the debugger. If you make a change, you can
either continue the debugging session or you can rebuild the application and test the
change - all without losing your place! This is where Paradigm C++ excels at making the
most of your development time.
If you have
multiple targets,
you can select
the target
connector from
the local menu of
a target node in
the Project view.
Step over/into
Run/Run to


