

Chapter 2: Numerical Modeling SEEP/W
Page 8
Quantitative predictions
Most engineers, when asked why they want to do some modeling, will say that they want to make a
prediction. They want to predict the seepage quantity, for example, or the time for a contaminant to travel
from the source to a seepage discharge point, or the time required from first filling a reservoir until
steady-state seepage conditions have been established in the embankment dam. The desire is to say
something about future behavior or performance.
Making quantitative predictions is a legitimate reason for doing modeling. Unfortunately, it is also the
most difficult part of modeling, since quantitative values are often directly related to the material
properties. The quantity of seepage, for example, is in large part controlled by the hydraulic conductivity
and, as a result, changing the hydraulic conductivity by an order of magnitude will usually change the
computed seepage quantity by an order of magnitude. The accuracy of quantitative prediction is directly
related to the accuracy of the hydraulic conductivity specified. Unfortunately, for a heterogeneous profile,
there is not a large amount of confidence about how precisely the hydraulic conductivity can be specified.
Sometimes defining the hydraulic conductivity within an order of magnitude is considered reasonable.
The confidence you have defining the hydraulic conductivity depends on many factors, but the general
difficulty of defining this soil parameter highlights the difficulty of undertaking modeling to make
quantitative predictions.
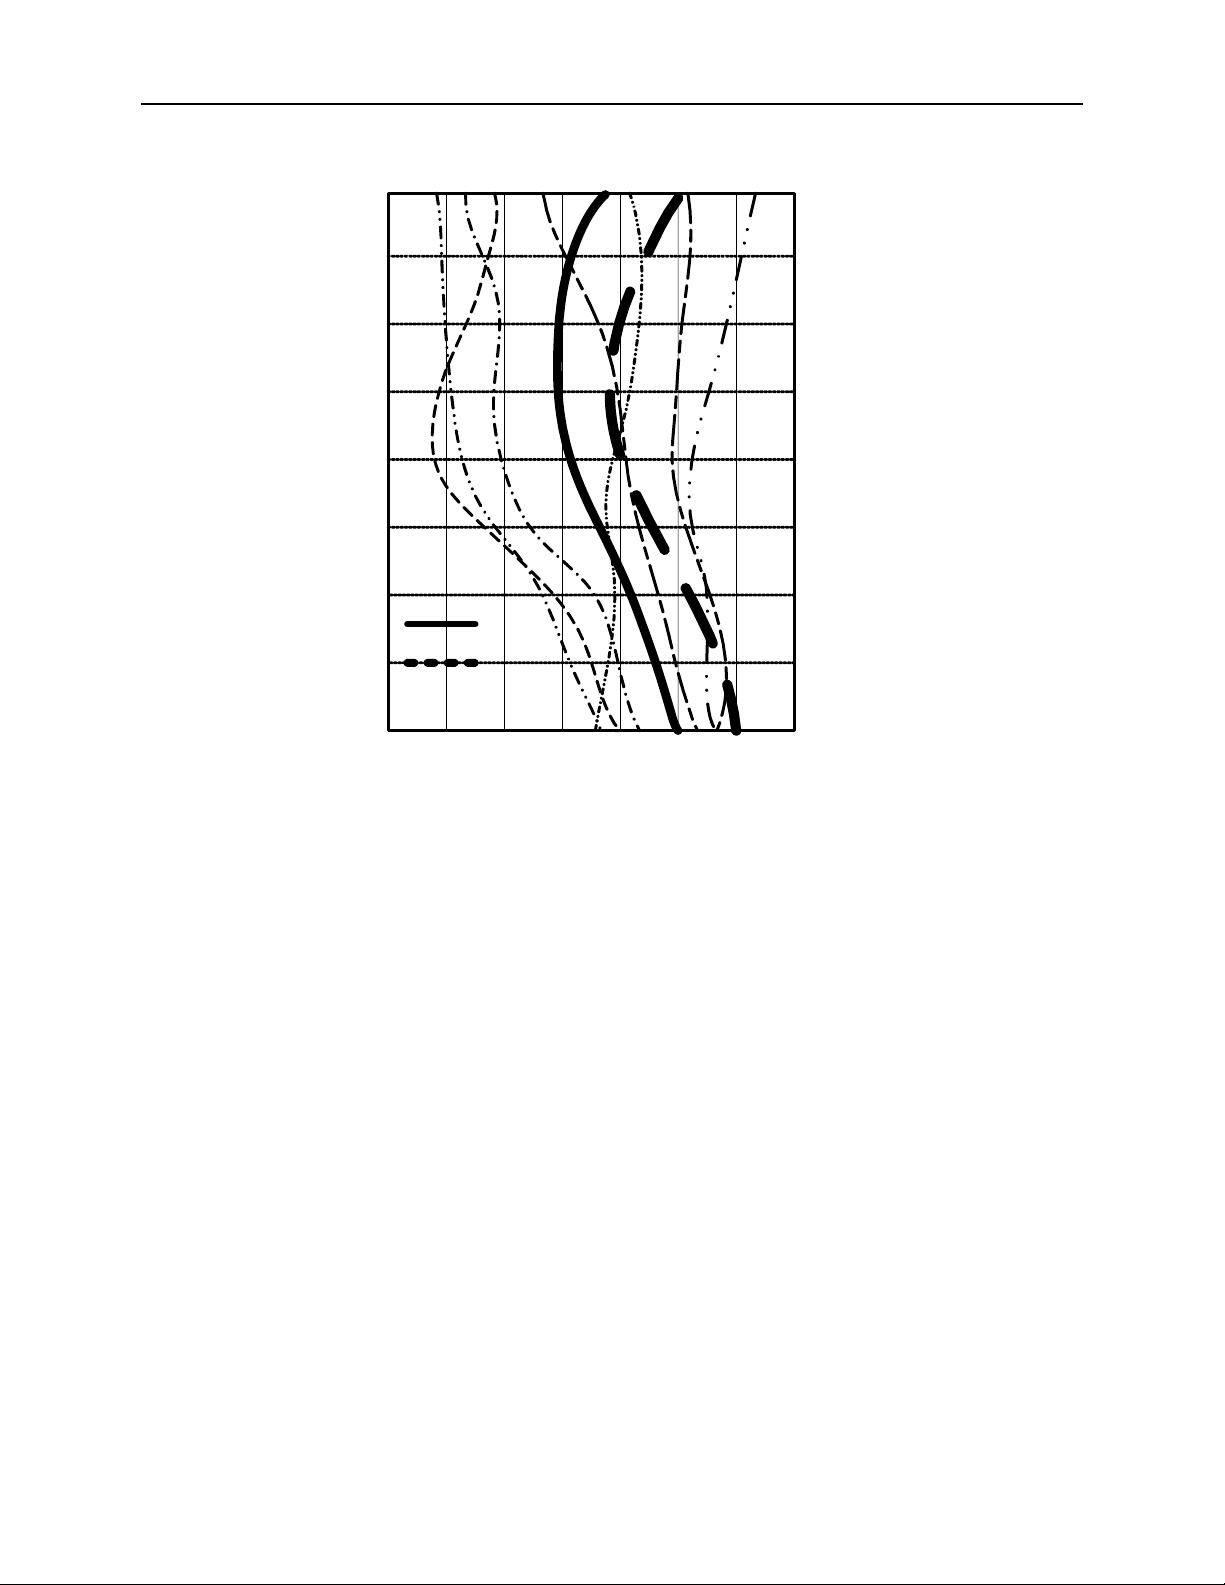
Carter et al. (2000) presented the results of a competition conducted by the German Society for
Geotechnics. Packages of information were distributed to consulting engineers and university research
groups. The participants were asked to predict the lateral deflection of a tie-back shoring wall for a deep
excavation in Berlin. During construction, the actual deflection was measured with inclinometers. Later
the predictions were compared with the actual measurements. Figure 2-5 shows the best eleven submitted
predictions. Other predictions were submitted, but were considered unreasonable and consequently not
included in the summary.
There are two heavy dark lines superimposed on Figure 2-5. The dashed line on the right represents the
inclinometer measurements uncorrected for any possible base movement. It is likely the base of the
inclinometer moved together with the base of the wall. Assuming the inclinometer base moved about
10 mm, the solid heavy line in Figure 2-5 has been shifted to reflect the inclinometer base movement.
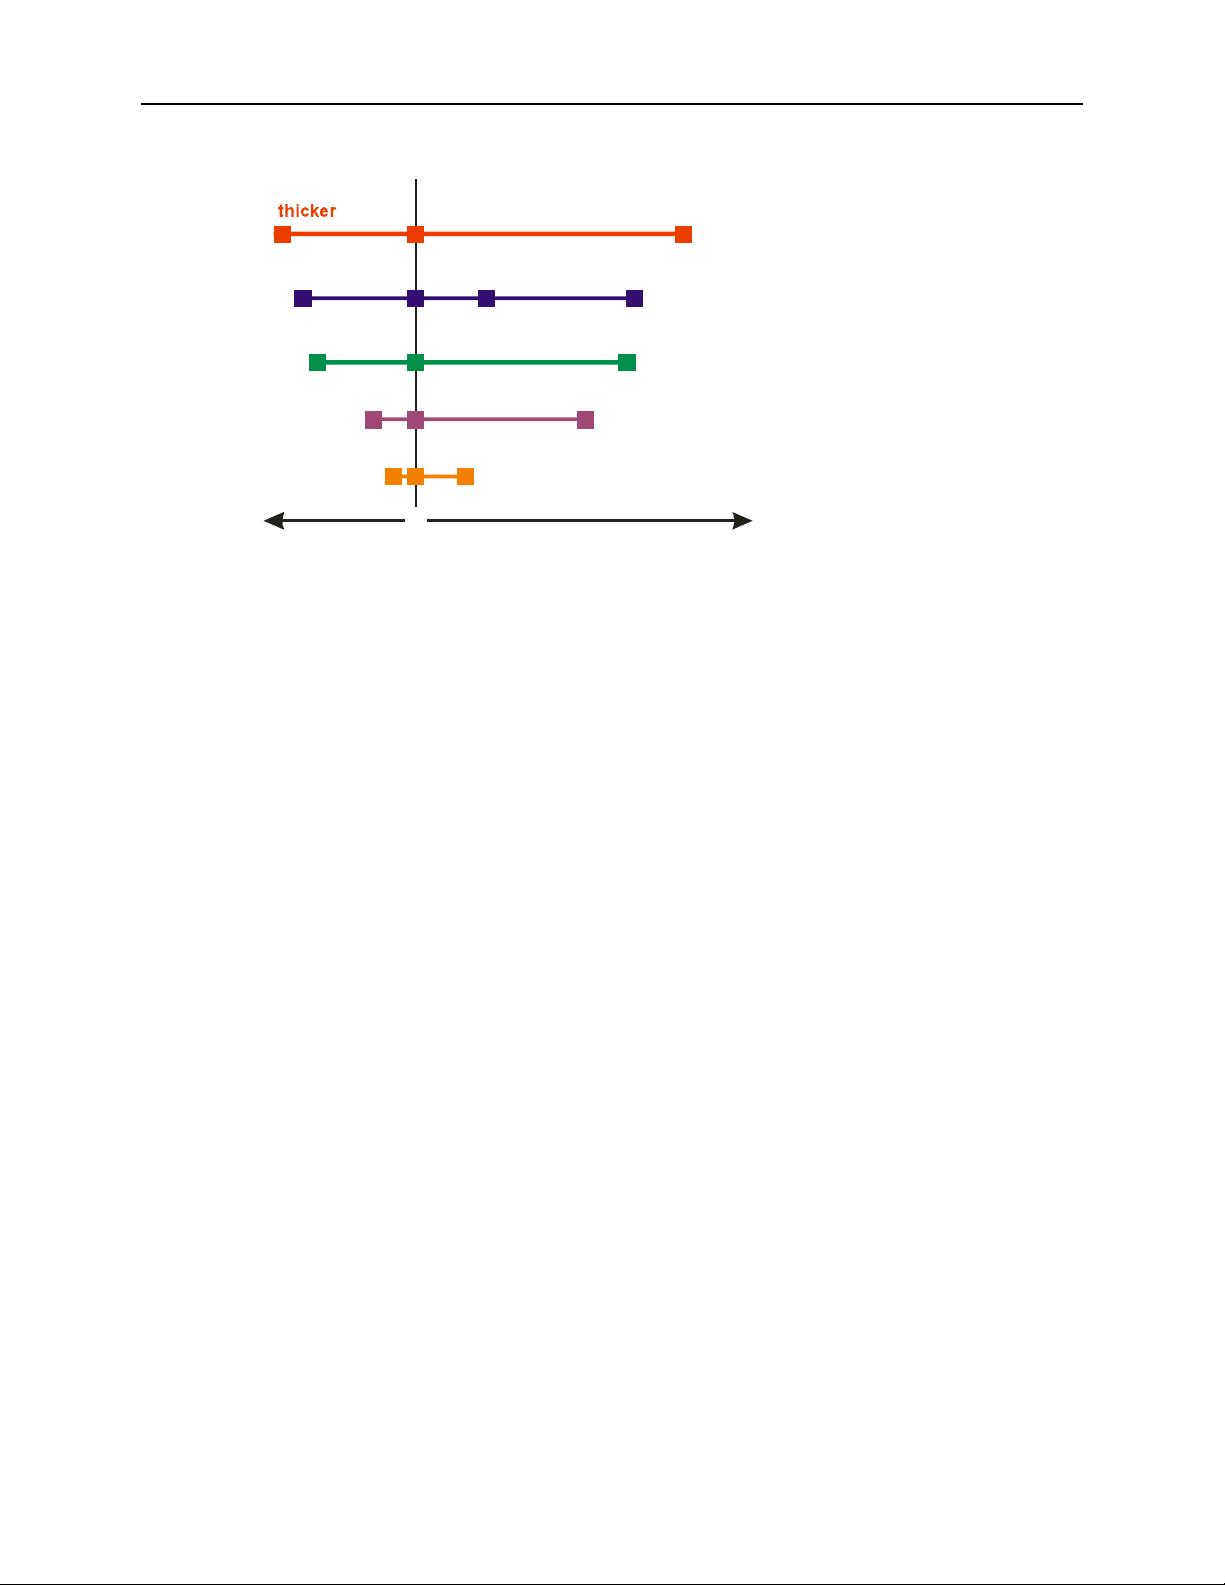
At first glance one might quickly conclude that the agreement between prediction and actual lateral
movement is very poor, especially since there appears to be a wide scatter in the predictions. This
exercise might be considered as an example of our inability to make accurate quantitative predictions.
However, a closer look at the results reveals a picture that is not so bleak. The depth of the excavation is
32 m. The maximum predicted lateral movement is just over 50 mm or 5 cm. This is an extremely small
amount of movement over the length of the wall – certainly not big enough to be visually noticeable.
Furthermore, the actual measurements, when corrected for base movement fall more or less in the middle
of the predictions. Most important to consider are the trends presented by many of the predicted results.
Many of them predict a deflected shape similar to the actual measurements. In other words, the
predictions simulated the correct relative response of the wall.
Consequently, we can argue that our ability to make accurate predictions is poor, but we can also argue
that the predictions are amazingly good. The predictions fall on either side of the measurements and the
deflected shapes are correct. In the end, the modeling provided a correct understanding of the wall
behavior, which is more than enough justification for doing the modeling, and may be the greatest benefit
of numerical modeling, as we will see in more detail later.
剩余206页未读,继续阅读

Matla6
- 粉丝: 2
- 资源: 11
 我的内容管理
收起
我的内容管理
收起
- 我的资源
快来上传第一个资源
 我的收益 登录查看自己的收益
 我的积分
登录查看自己的积分
我的积分
登录查看自己的积分
 我的C币
登录后查看C币余额
我的C币
登录后查看C币余额
 我的收藏
我的收藏  我的下载
我的下载  下载帮助
下载帮助

会员权益专享


最新资源
- 谷歌文件系统下的实用网络编码技术在分布式存储中的应用
- 跨国媒体对南亚农村社会的影响:以斯里兰卡案例的社会学分析
- RFM2g接口驱动操作手册:API与命令行指南
- 基于裸手的大数据自然人机交互关键算法研究
- ABAQUS下无人机机翼有限元分析与局部设计研究
- TCL基础教程:语法、变量与操作详解
- FPGA与数字前端面试题集锦:流程、设计与Verilog应用
- 2022全球互联网技术人才前瞻:元宇宙驱动下的创新与挑战
- 碳排放权交易实战手册(第二版):设计与实施指南
- 2022新经济新职业洞察:科技驱动下的百景变革
- 红外与可见光人脸融合识别技术探究
- NXP88W8977:2.4/5 GHz 双频 Wi-Fi4 + Bluetooth 5.2 合体芯片
- NXP88W8987:集成2.4/5GHz Wi-Fi 5与蓝牙5.2的单芯片解决方案
- TPA3116D2DADR: 单声道数字放大器驱动高达50W功率
- TPA3255-Q1:315W车载A/D类音频放大器,高保真、宽频设计
- 42V 输入 5A 降压稳压器 TPS54540B-Q1 的特点和应用
资源上传下载、课程学习等过程中有任何疑问或建议,欢迎提出宝贵意见哦~我们会及时处理!
点击此处反馈


