
C#实现实现Windows Form调用调用R进行绘图与显示的方法进行绘图与显示的方法
众所周知R软件功能非常强大,可以很好的进行各类统计,并能输出图形。下面介绍一种R语言和C#进行通信的
方法,并将R绘图结果显示到WinForm UI界面上的方法,文中介绍的很详细,需要的朋友可以参考下。
一、前提准备一、前提准备
安装R软件,需要安装32位的R软件,64位的调用会报错。另外就是讲R添加到电脑环境变量中。
打开R软件,安装包 scatterplot3d,演示需要用到此R包。
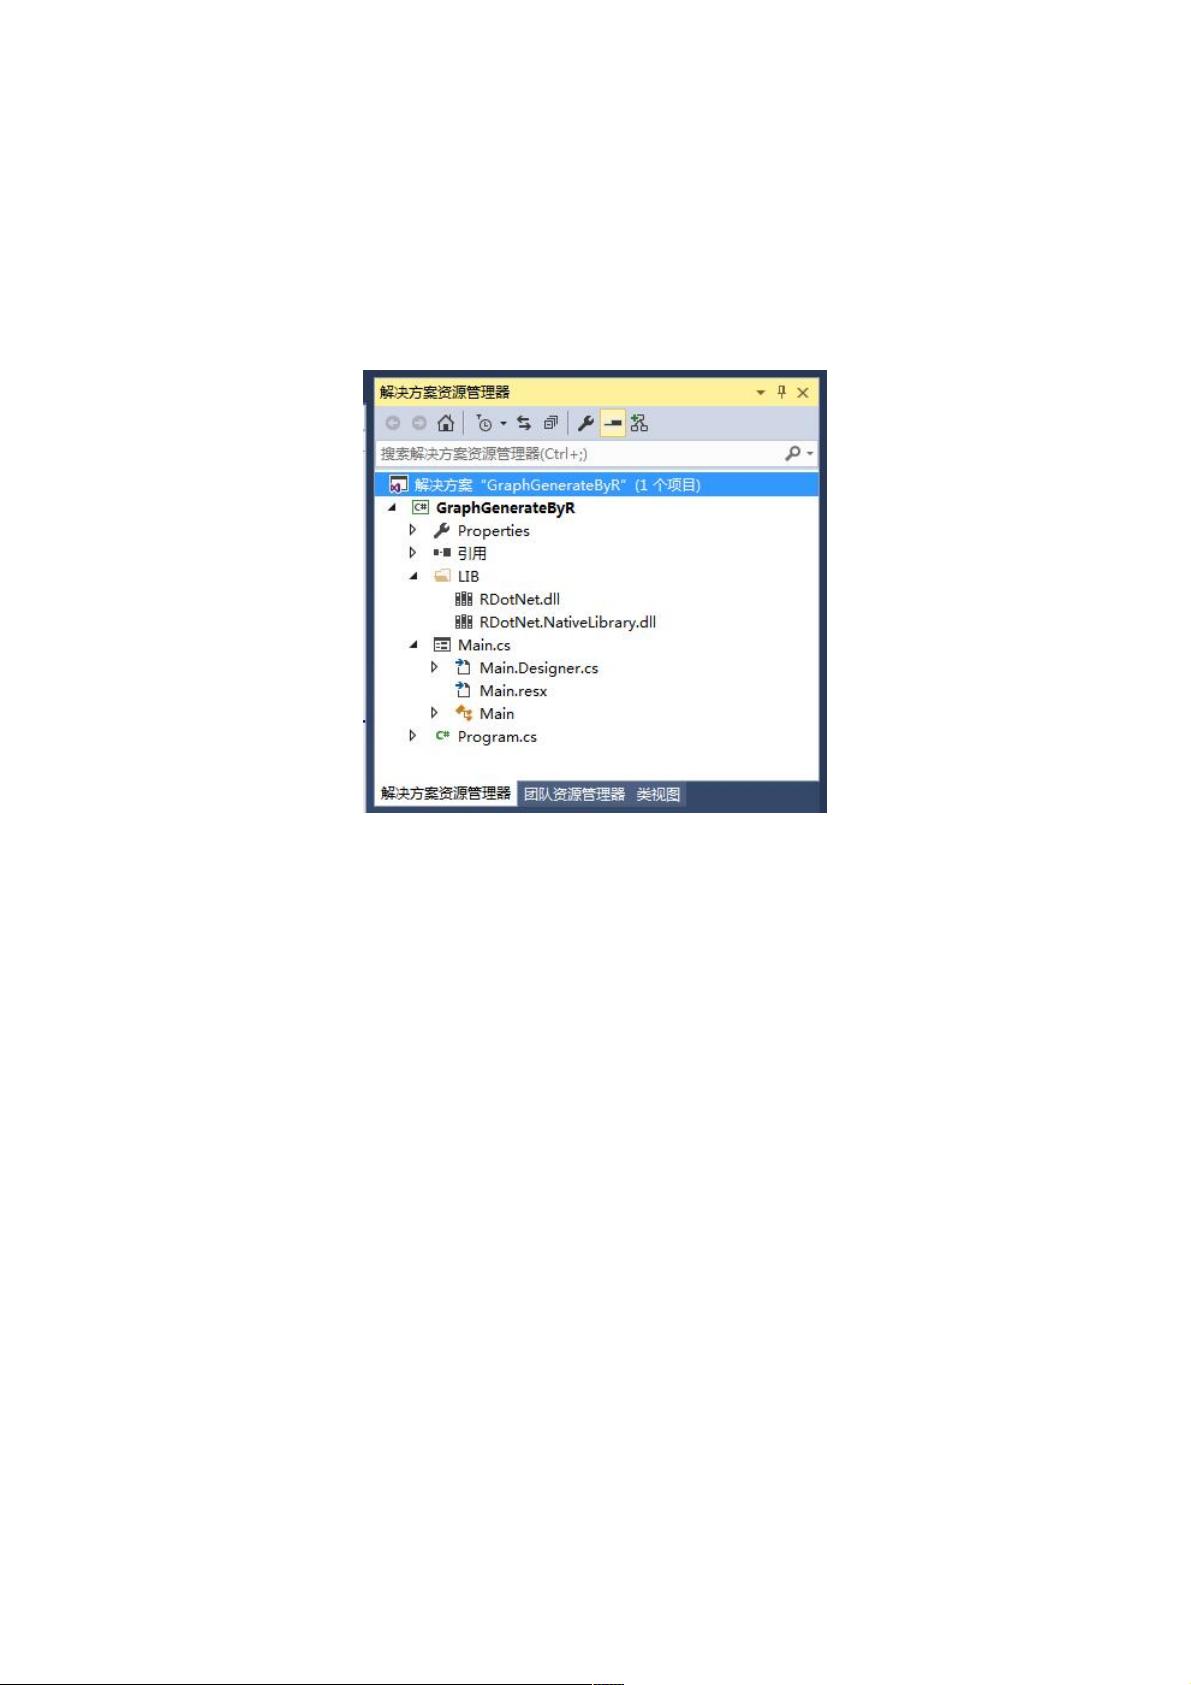
二、创建项目二、创建项目GraphGenerateByR,项目结构如下:,项目结构如下:
注意:注意:这里需要引入RDotNet类库,可以自行下载:http://rdotnet.codeplex.com/
三、三、Main窗体代码窗体代码
using System;
using System.Collections.Generic;
using System.ComponentModel;
using System.Data;
using System.Drawing;
using System.Linq;
using System.Text;
using System.Windows.Forms;
namespace GraphGenerateByR
{
using RDotNet;
public partial class Main : Form
{
public Main()
{
InitializeComponent();
}
REngine engine = null;
string Rcode = "";
private void btnPlot_Click(object sender, EventArgs e)
{
try
{
if(this.txtRcode.Text=="")
{
Rcode = @"library('scatterplot3d')
z <- seq(-10, 10, 0.01)
x <- cos(z)
y <- sin(z)
scatterplot3d(x, y, z, highlight.3d=TRUE, col.axis='blue', col.grid='lightblue',main='3d绘图',pch=20)
";
}
else
{
Rcode = this.txtRcode.Text;

weixin_38746166
- 粉丝: 8
- 资源: 960
 我的内容管理
收起
我的内容管理
收起
- 我的资源
快来上传第一个资源
 我的收益 登录查看自己的收益
 我的积分
登录查看自己的积分
我的积分
登录查看自己的积分
 我的C币
登录后查看C币余额
我的C币
登录后查看C币余额
 我的收藏
我的收藏  我的下载
我的下载  下载帮助
下载帮助

会员权益专享


最新资源
- VMP技术解析:Handle块优化与壳模板初始化
- C++ Primer 第四版更新:现代编程风格与标准库
- 计算机系统基础实验:缓冲区溢出攻击(Lab3)
- 中国结算网上业务平台:证券登记操作详解与常见问题
- FPGA驱动的五子棋博弈系统:加速与创新娱乐体验
- 多旋翼飞行器定点位置控制器设计实验
- 基于流量预测与潮汐效应的动态载频优化策略
- SQL练习:查询分析与高级操作
- 海底数据中心散热优化:从MATLAB到动态模拟
- 移动应用作业:MyDiaryBook - Google Material Design 日记APP
- Linux提权技术详解:从内核漏洞到Sudo配置错误
- 93分钟快速入门 LaTeX:从入门到实践
- 5G测试新挑战与罗德与施瓦茨解决方案
- EAS系统性能优化与故障诊断指南
- Java并发编程:JUC核心概念解析与应用
- 数据结构实验报告:基于不同存储结构的线性表和树实现
资源上传下载、课程学习等过程中有任何疑问或建议,欢迎提出宝贵意见哦~我们会及时处理!
点击此处反馈


