没有合适的资源?快使用搜索试试~ 我知道了~
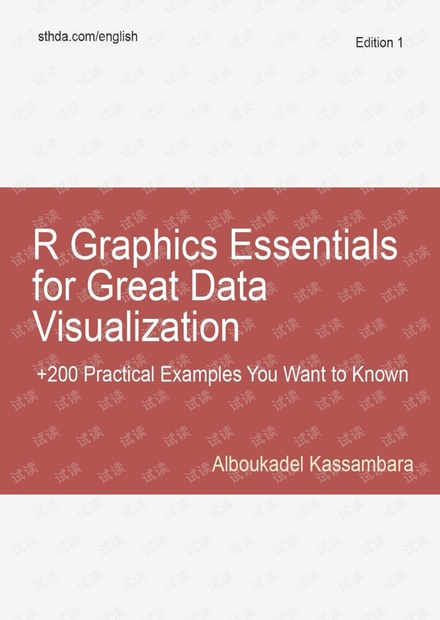
首页R Graphics Essentials for Great Data Visualization
R Graphics Essentials for Great Data Visualization
需积分: 32 19 下载量 45 浏览量
更新于2023-03-16
评论 1
收藏 8.45MB PDF 举报
R Graphics Essentials for Great Data Visualization: +200 Practical Examples You Want to Know for Data Science By 作者: Mr Alboukadel Kassambara ISBN-10 书号: 1979748101 ISBN-13 书号: 9781979748100 Edition 版本: 1 出版日期: 2017-11-14 pages 页数: 257 1 About the author 2 R Basics for Data Visualization 3 Plot One Variable 4Plot Grouped Data 5 Plot Two Continuous Variables 6 Plot Multivariate Continuous Data 7 Visualizing Multivariate Categorical Data 8 Plot Time Series Data 9 Facets:Multi-Panels GGPlot 10 Arrange Multiple GGPlot on One Page 11 Customize GGPlot References
资源详情
资源评论
资源推荐


R Graphics Essentials for Great
Data Visualization
Alboukadel KASSAMBARA
Download from finelybook 7450911@qq.com
2

R Graphics Essentials for Great
Data Visualization
Download from finelybook 7450911@qq.com
3

Preface
Download from finelybook 7450911@qq.com
4

0.1 What you will learn
Data visualization is one of the most important part of data science. Many
books and courses present a catalogue of graphics but they don't teach you
which charts to use according to the type of the data.
In this book, we start by presenting the key graphic systems and packages
available in R, including R base graphs, lattice and ggplot2 plotting systems.
Next, we provide practical examples to create great graphics for the right data
using either the ggplot2 package and extensions or the traditional R graphics.
With this book, you 'll learn:
How to quickly create beautiful graphics using ggplot2 packages
How to properly customize and annotate the plots
Type of graphics for visualizing categorical and continuous variables
How to add automatically p-values to box plots, bar plots and
alternatives
How to add marginal density plots and correlation coefficients to scatter
plots
Key methods for analyzing and visualizing multivariate data
R functions and packages for plotting time series data
How to combine multiple plots on one page to create production-quality
figures.
Download from finelybook 7450911@qq.com
5
剩余256页未读,继续阅读
THESUMMERE
- 粉丝: 23
- 资源: 329
上传资源 快速赚钱
 我的内容管理
收起
 我的资源
快来上传第一个资源
 我的收益 登录查看自己的收益
 我的积分
登录查看自己的积分
 我的C币
登录后查看C币余额
 我的收藏
我的收藏  我的下载
我的下载  下载帮助
下载帮助

会员权益专享
最新资源
- RTL8188FU-Linux-v5.7.4.2-36687.20200602.tar(20765).gz
- c++校园超市商品信息管理系统课程设计说明书(含源代码) (2).pdf
- 建筑供配电系统相关课件.pptx
- 企业管理规章制度及管理模式.doc
- vb打开摄像头.doc
- 云计算-可信计算中认证协议改进方案.pdf
- [详细完整版]单片机编程4.ppt
- c语言常用算法.pdf
- c++经典程序代码大全.pdf
- 单片机数字时钟资料.doc
- 11项目管理前沿1.0.pptx
- 基于ssm的“魅力”繁峙宣传网站的设计与实现论文.doc
- 智慧交通综合解决方案.pptx
- 建筑防潮设计-PowerPointPresentati.pptx
- SPC统计过程控制程序.pptx
- SPC统计方法基础知识.pptx
资源上传下载、课程学习等过程中有任何疑问或建议,欢迎提出宝贵意见哦~我们会及时处理!
点击此处反馈


安全验证
文档复制为VIP权益,开通VIP直接复制
 信息提交成功
评论0