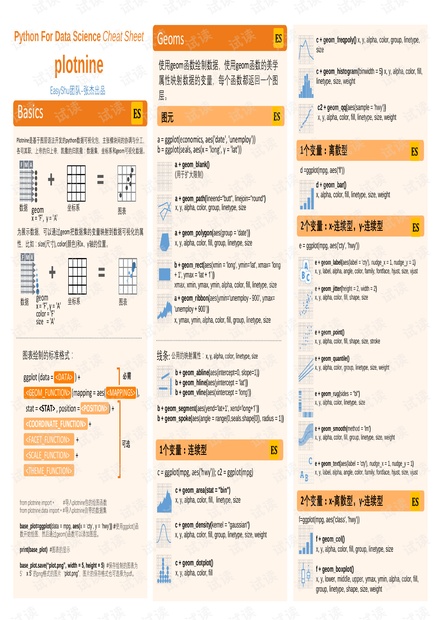
Plotnine是基于图层语法开发的python数据可视化包,主张模块间的协调与分工,
各司其职,上帝的归上帝,凯撒的归凯撒:数据集,坐标系和geom可视化数据。
数据
geom
x = ‘F’, y = 'A'
坐标系
图表
数据
geom
x = ‘F’, y = 'A'
color = 'F'
size = 'A'
F M A
F M A
Python For Data Science Cheat Sheet
plotnine
Basics
Geoms
坐标系
图表
为展示数据,可以通过geom把数据集的变量映射到数据可视化的属
性,比如:size(尺寸), color(颜色)和x、y轴的位置。
图表绘制的标准格式:
from plotnine import * #导入plotnine包的绘图函数
from plotnine.data import * #导入plotnine自带的数据集
base_plot=ggplot(data = mpg, aes(x = 'cty', y = 'hwy')) #使用ggplot()函
数开始绘图,然后通过geom()函数可以添加图层。
print(base_plot) #图表的显示
base_plot.save(“plot.png”, width = 5, height = 5) #保存绘制的图表为
5’ x 5’ 的png格式的图片“plot.png”,图片的保存格式也可选择为pdf。
ggplot (data = <DATA> ) +
<GEOM_FUNCTION> (mapping = aes( <MAPPINGS> ),
stat = <STAT> , position = <POSITION> ) +
<COORDINATE_FUNCTION> +
<FACET_FUNCTION> +
<SCALE_FUNCTION> +
<THEME_FUNCTION>
可选
必需
使用geom函数绘制数据,使用geom函数的美学
属性映射数据的变量,每个函数都返回一个图
层。
图元
a + geom_ribbon(aes(ymin='unemploy - 900', ymax=
'unemploy + 900’))
x, ymax, ymin, alpha, color, fill, group, linetype, size
a = ggplot(economics, aes('date', 'unemploy'))
b = ggplot(seals, aes(x = 'long', y = 'lat'))
a + geom_blank()
(用于扩大限制)
a + geom_path(lineend="butt", linejoin="round")
x, y, alpha, color, group, linetype, size
a + geom_polygon(aes(group = 'date'))
x, y, alpha, color, fill, group, linetype, size
b + geom_rect(aes(xmin = 'long', ymin='lat', xmax= 'long
+ 1', ymax = 'lat + 1’))
xmax, xmin, ymax, ymin, alpha, color, fill, linetype, size
EasyShu团队-张杰出品
线条
:
公用的映射属性:
x, y, alpha, color, linetype, size
b + geom_abline(aes(intercept=0, slope=1))
b + geom_hline(aes(yintercept = 'lat'))
b + geom_vline(aes(xintercept = 'long'))
b + geom_segment(aes(yend='lat+1', xend='long+1’))
b + geom_spoke(aes(angle = range(0,seals.shape[0]), radius = 1))
1个变量:连续型
c = ggplot(mpg, aes('hwy')); c2 = ggplot(mpg)
c + geom_area(stat = "bin")
x, y, alpha, color, fill, linetype, size
c + geom_density(kernel = "gaussian")
x, y, alpha, color, fill, group, linetype, size, weight
c + geom_dotplot()
x, y, alpha, color, fill
c + geom_freqpoly() x, y, alpha, color, group, linetype,
size
c + geom_histogram(binwidth = 5) x, y, alpha, color, fill,
linetype, size, weight
c2 + geom_qq(aes(sample = 'hwy'))
x, y, alpha, color, fill, linetype, size, weight
1个变量:离散型
d =ggplot(mpg, aes('fl'))
d + geom_bar()
x, alpha, color, fill, linetype, size, weight
2个变量:x-连续型,y-连续型
e + geom_label(aes(label = 'cty'), nudge_x = 1, nudge_y = 1)
x, y, label, alpha, angle, color, family, fontface, hjust, size, vjust
e + geom_jitter(height = 2, width = 2)
x, y, alpha, color, fill, shape, size
e + geom_point()
x, y, alpha, color, fill, shape, size, stroke
e + geom_quantile()
x, y, alpha, color, group, linetype, size, weight
e + geom_rug(sides = "bl")
x, y, alpha, color, linetype, size
e + geom_smooth(method = 'lm')
x, y, alpha, color, fill, group, linetype, size, weight
e + geom_text(aes(label = 'cty'), nudge_x = 1, nudge_y = 1)
x, y, label, alpha, angle, color, family, fontface, hjust, size, vjust
e = ggplot(mpg, aes('cty', 'hwy'))
2个变量:x-离散型,y-连续型
f=ggplot(mpg, aes('class', 'hwy'))
f + geom_col()
x, y, alpha, color, fill, group, linetype, size
f + geom_boxplot()
x, y, lower, middle, upper, ymax, ymin, alpha, color, fill,
group, linetype, shape, size, weight

GISerandCoder
- 粉丝: 3414
- 资源: 3
 我的内容管理
收起
我的内容管理
收起
- 我的资源
快来上传第一个资源
 我的收益 登录查看自己的收益
 我的积分
登录查看自己的积分
我的积分
登录查看自己的积分
 我的C币
登录后查看C币余额
我的C币
登录后查看C币余额
 我的收藏
我的收藏  我的下载
我的下载  下载帮助
下载帮助

会员权益专享


最新资源
- RTL8188FU-Linux-v5.7.4.2-36687.20200602.tar(20765).gz
- c++校园超市商品信息管理系统课程设计说明书(含源代码) (2).pdf
- 建筑供配电系统相关课件.pptx
- 企业管理规章制度及管理模式.doc
- vb打开摄像头.doc
- 云计算-可信计算中认证协议改进方案.pdf
- [详细完整版]单片机编程4.ppt
- c语言常用算法.pdf
- c++经典程序代码大全.pdf
- 单片机数字时钟资料.doc
- 11项目管理前沿1.0.pptx
- 基于ssm的“魅力”繁峙宣传网站的设计与实现论文.doc
- 智慧交通综合解决方案.pptx
- 建筑防潮设计-PowerPointPresentati.pptx
- SPC统计过程控制程序.pptx
- SPC统计方法基础知识.pptx
资源上传下载、课程学习等过程中有任何疑问或建议,欢迎提出宝贵意见哦~我们会及时处理!
点击此处反馈


评论0