
1. 常规绘图数据提取
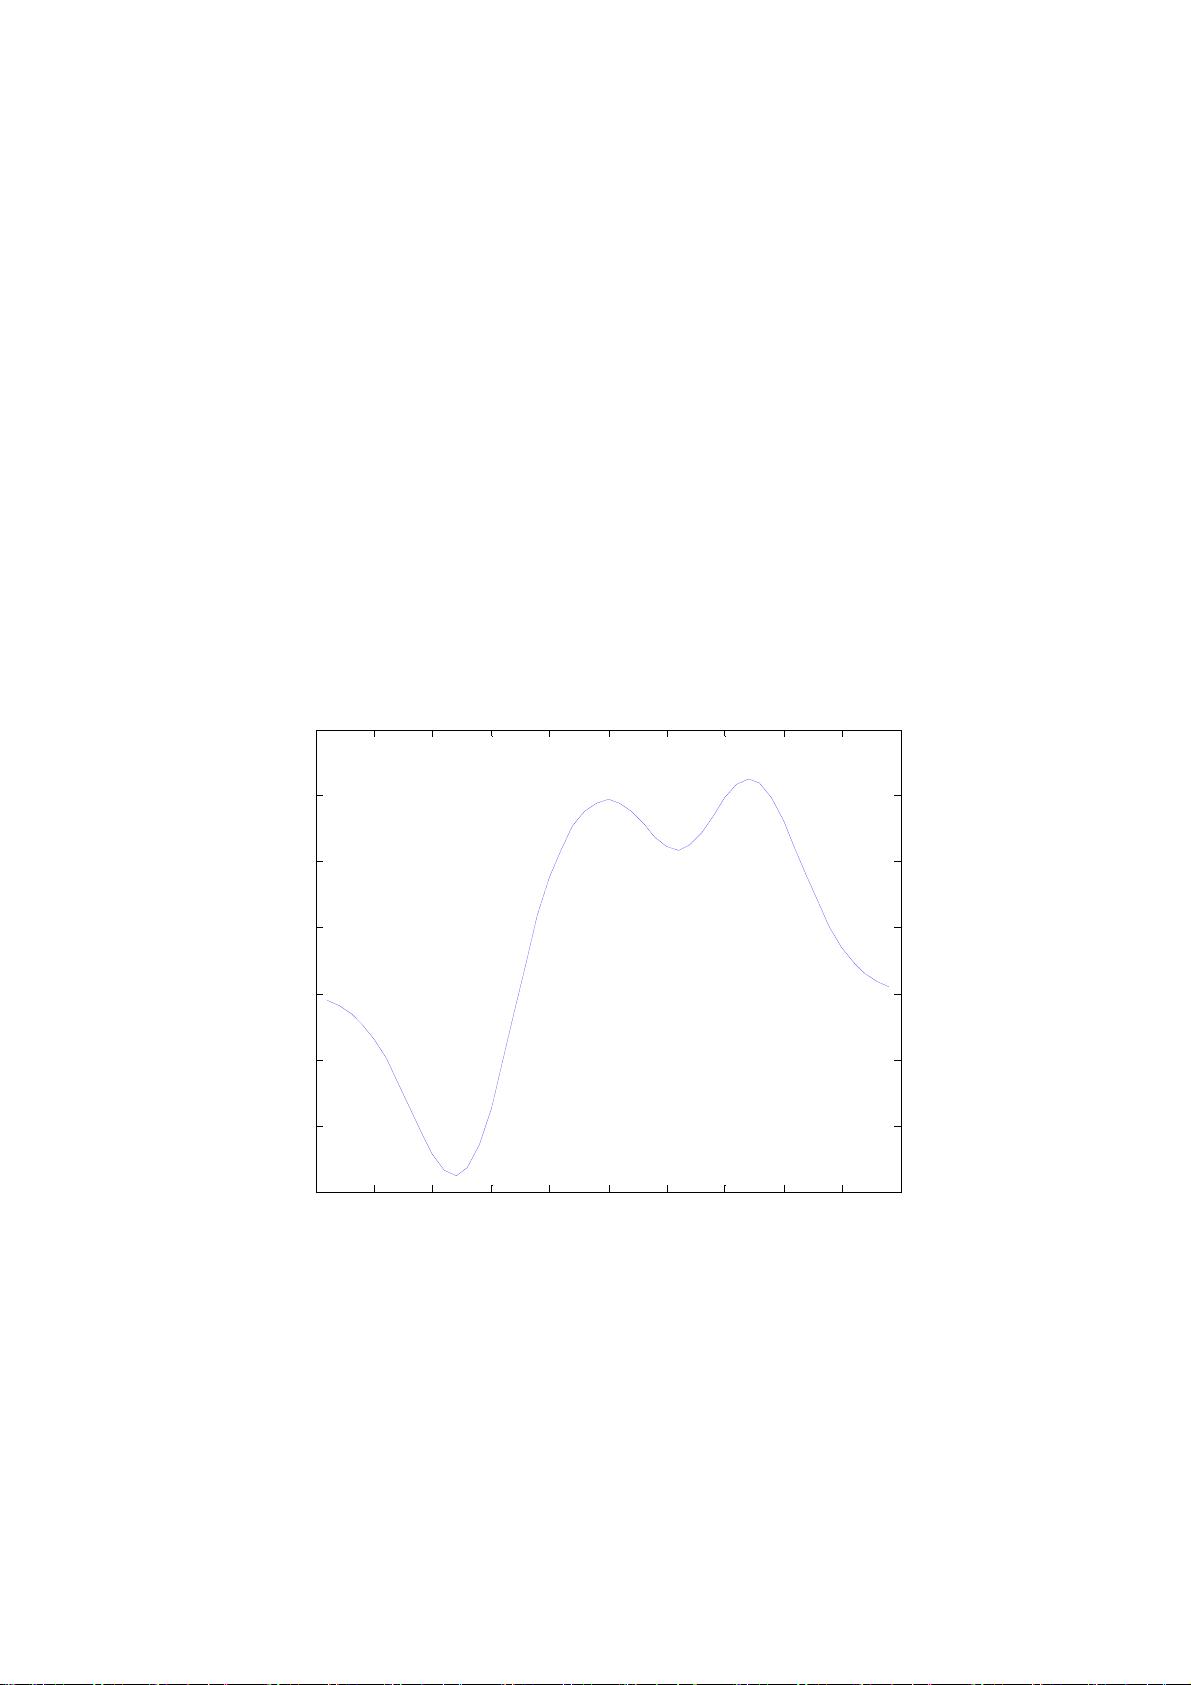
(1)首先随便设定一些点,然后绘制一条曲线:
Z = peaks;
h = plot(Z(:,33));
(2)然后提取曲线上的点,找到这些点中的最值并标注:
x = get(h,'XData'); % Get the plotted data
y = get(h,'YData');
imin = find(min(y) == y); % Find the index of the min and max
imax = find(max(y) == y);
text(x(imin),y(imin),[' Minimum = ',num2str(y(imin))],...
'VerticalAlignment','middle',...
'HorizontalAlignment','left',...
'FontSize',14)
text(x(imax),y(imax),['Maximum = ',num2str(y(imax))],...
'VerticalAlignment','bottom',...
'HorizontalAlignment','right',...
'FontSize',14)
0 5 10 15 20 25 30 35 40 45 50
-3
-2
-1
0
1
2
3
4
Minimum = -2.7633
Maximum = 3.254
2. 隐函数绘图只有一个变量数据提取
>> subplot(211)
>> h=ezplot('cos(x)');
>> hold on
>> x=get(h,'xdata');
>> y=get(h,'ydata');
>> subplot(212)
>> plot(x,y,'*r')


