
# Import everything from matplotlib (numpy is accessible via 'np' alias)
from pylab import *
# Create a new figure of size 8x6 points, using 80 dots per inch
figure(figsize=(8,6), dpi=80)
# Create a new subplot from a grid of 1x1
subplot(1,1,1)
X = np.linspace(-np.pi, np.pi, 256,endpoint=True)
C,S = np.cos(X), np.sin(X)
# Plot cosine using blue color with a continuous line of width 1 (pixels)
plot(X, C, color="blue", linewidth=1.0, linestyle="-")
# Plot sine using green color with a continuous line of width 1 (pixels)
plot(X, S, color="green", linewidth=1.0, linestyle="-")
# Set x limits
xlim(-4.0,4.0)
# Set x ticks
xticks(np.linspace(-4,4,9,endpoint=True))
# Set y limits
ylim(-1.0,1.0)
# Set y ticks
yticks(np.linspace(-1,1,5,endpoint=True))
# Save figure using 72 dots per inch
# savefig("exercice_2.png",dpi=72)
# Show result on screen
show()
更改色彩和线宽
(http://www.loria.fr/~rougier/teaching/matplotlib/scripts/exercice_3.py)
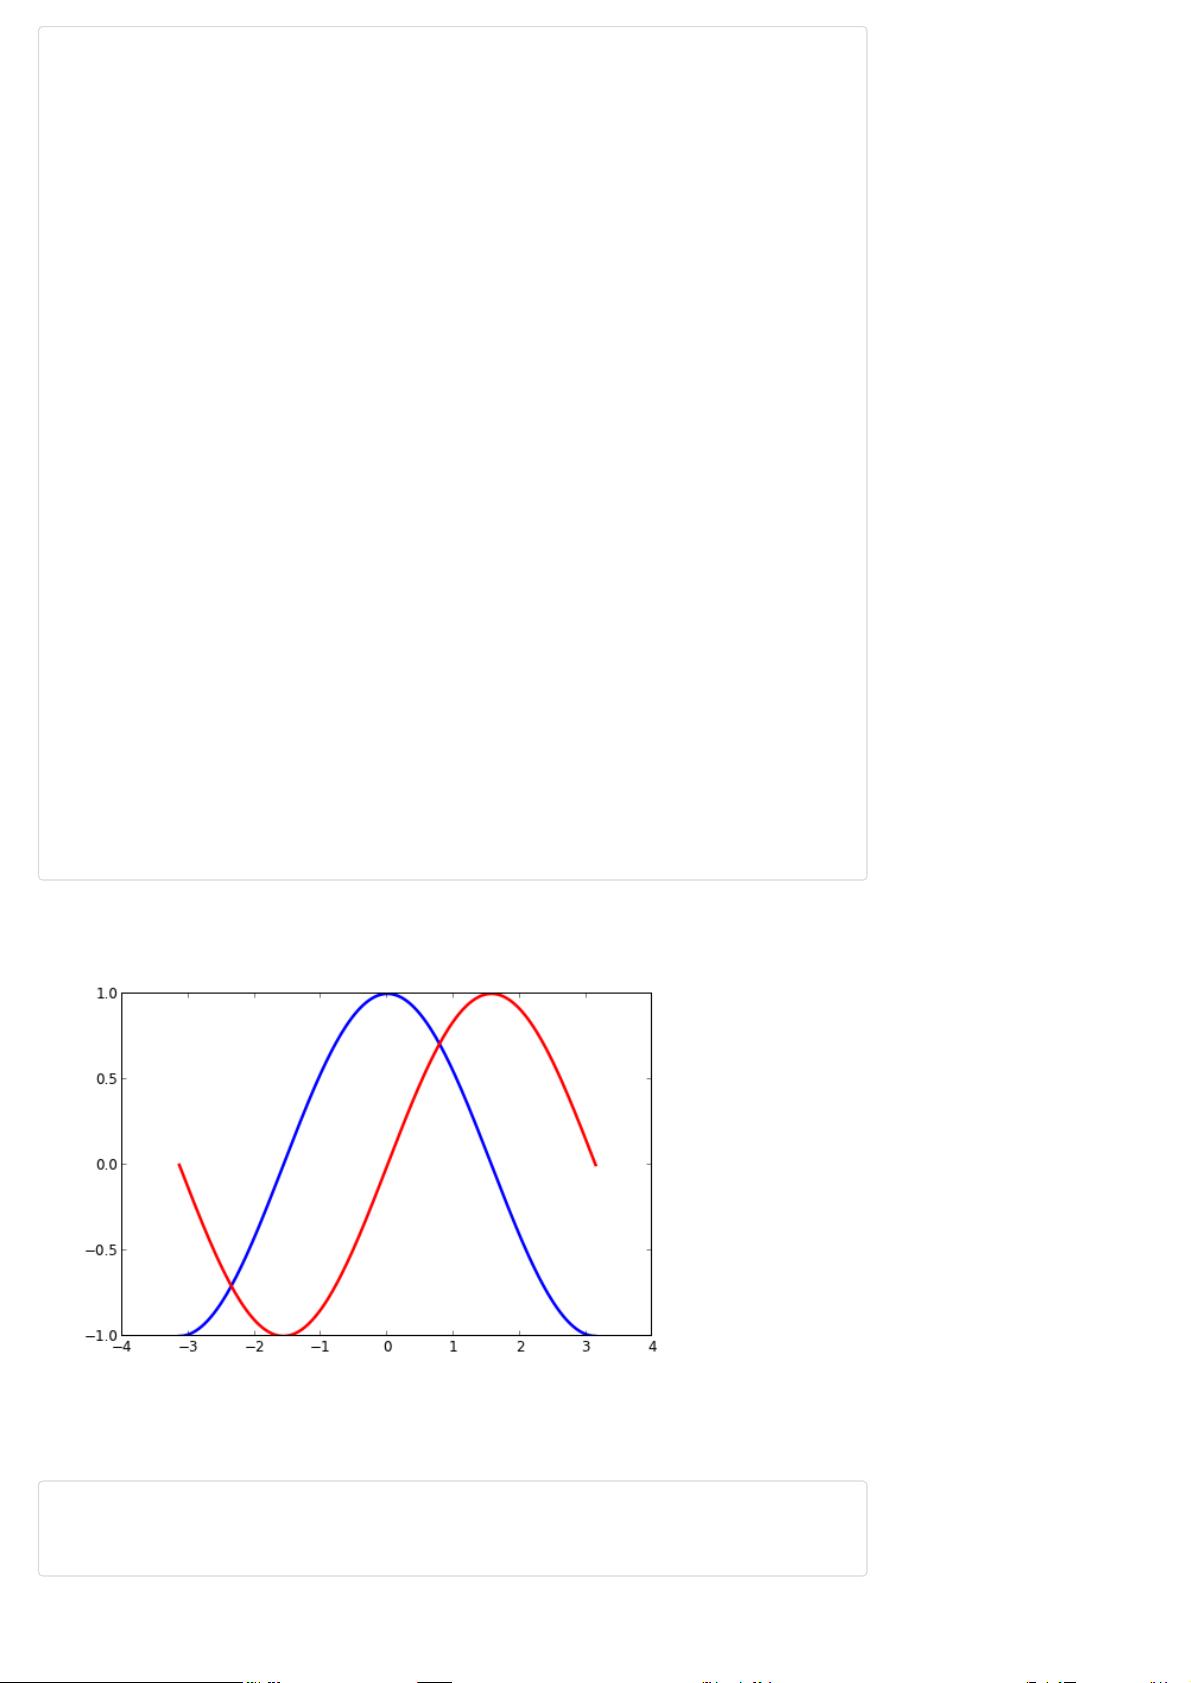
首先,我们想要余弦是蓝色而正弦是红色,它们的线条都稍厚一点。我们将也稍微更改图片大小来
使它更宽一点。
figure(figsize=(10,6), dpi=80)
plot(X, C, color="blue", linewidth=2.5, linestyle="-")
plot(X, S, color="red", linewidth=2.5, linestyle="-")
设置边界
剩余18页未读,继续阅读


