
ADM3483E/ADM3486E/ADM3488E/ADM3490E/ADM3491E
Rev. A | Page 5 of 20
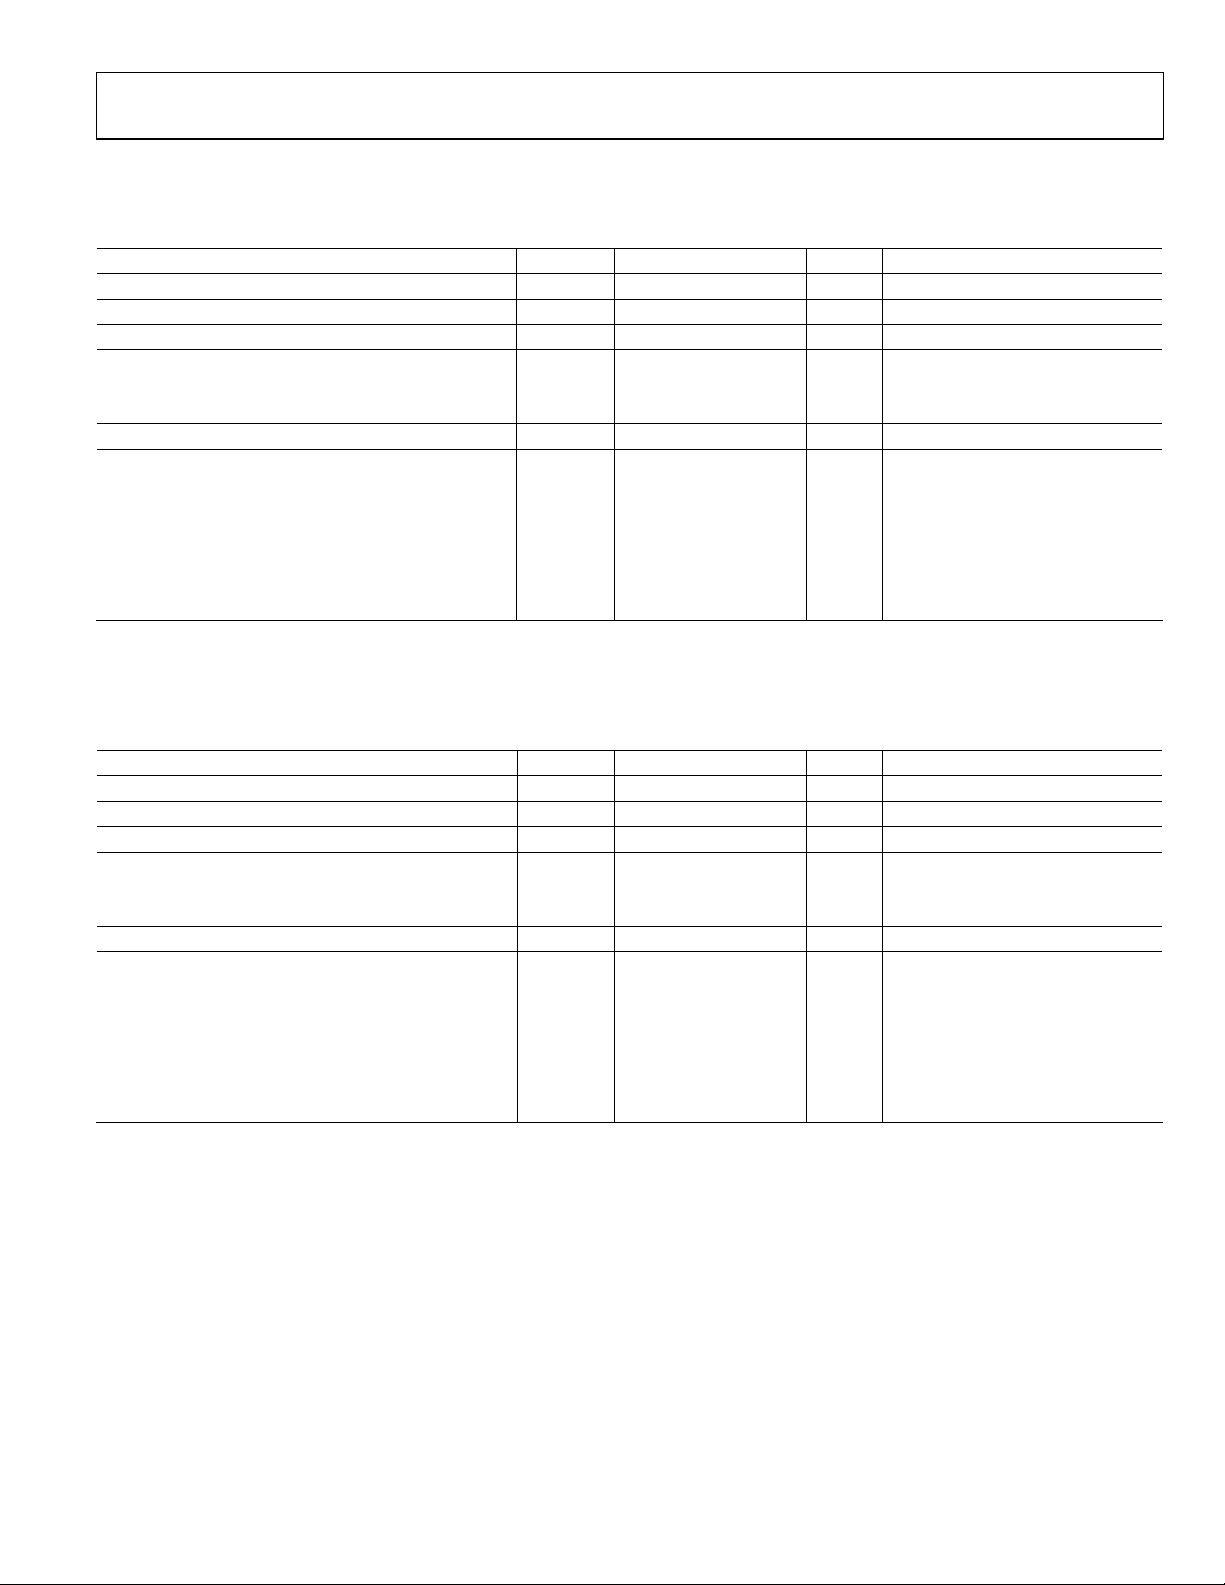
DRIVER TIMING SPECIFICATIONS
V
CC
= 3.3 V, T
A
= 25°C.
Table 3. ADM3483E/ADM3488E
Parameter Symbol Min Typ Max Unit Test Conditions/Comments
MAXIMUM DATA RATE 250 kbps
DIFFERENTIAL OUTPUT DELAY t
DD
600 900 1400 ns R
L
= 60 Ω (see Figure 10)
DIFFERENTIAL OUTPUT TRANSITION TIME t
TD
400 740 1200 ns R
L
= 60 Ω (see Figure 10)
PROPAGATION DELAY
From Low to High Level t
PLH
700 930 1500 ns R
L
= 27 Ω (see Figure 11)
From High to Low Level t
PHL
700 930 1500 ns R
L
= 27 Ω (see Figure 11)
|t
PLH
− t
PHL
| PROPAGATION DELAY SKEW
1
t
PDS
±50 ns R
L
= 27 Ω (see Figure 11)
ENABLE/DISABLE TIMING (ADM3483E ONLY)
Enable Time to Low Level t
PZL
900 1300 ns R
L
= 110 Ω (see Figure 13)
Enable Time to High Level t
PZH
600 800 ns R
L
= 110 Ω (see Figure 12)
Disable Time from Low Level t
PLZ
50 80 ns R
L
= 110 Ω (see Figure 13)
Disable Time from High Level t
PHZ
50 80 ns R
L
= 110 Ω (see Figure 12)
Enable Time from Shutdown to Low Level t
PSL
1.9 2.7 μs R
L
= 110 Ω (see Figure 13)
Enable Time from Shutdown to High Level t
PSH
2.2 3.0 μs R
L
= 110 Ω (see Figure 12)
1
Measured on |t
PLH
(Y) − t
PHL
(Y)| and |t
PLH
(Z) − t
PHL
(Z)|.
V
CC
= 3.3 V, T
A
= 25°C.
Table 4. ADM3486E
Parameter Symbol Min Typ Max Unit Test Conditions/Comments
MAXIMUM DATA RATE 2.5 Mbps
DIFFERENTIAL OUTPUT DELAY t
DD
20 42 70 ns R
L
= 60 Ω (see Figure 10)
DIFFERENTIAL OUTPUT TRANSITION TIME t
TD
15 28 60 ns R
L
= 60 Ω (see Figure 10)
PROPAGATION DELAY
From Low to High Level t
PLH
20 42 75 ns R
L
= 27 Ω (see Figure 11)
From High to Low Level t
PHL
20 42 75 ns R
L
= 27 Ω (see Figure 11)
|t
PLH
− t
PHL
| PROPAGATION DELAY SKEW
1
t
PDS
−6 ±12 ns R
L
= 27 Ω (see Figure 11)
ENABLE/DISABLE TIMING
Enable Time to Low Level t
PZL
52 100 ns R
L
= 110 Ω (see Figure 13)
Enable Time to High Level t
PZH
52 100 ns R
L
= 110 Ω (see Figure 12)
Disable Time from Low Level t
PLZ
40 80 ns R
L
= 110 Ω (see Figure 13)
Disable Time from High Level t
PHZ
40 80 ns R
L
= 110 Ω (see Figure 12)
Enable Time from Shutdown to Low Level t
PSL
700 1000 ns R
L
= 110 Ω (see Figure 13)
Enable Time from Shutdown to High Level t
PSH
700 1000 ns R
L
= 110 Ω (see Figure 12)
1
Measured on |t
PLH
(Y) − t
PHL
(Y)| and |t
PLH
(Z) − t
PHL
(Z)|.
剩余20页未读,继续阅读


